A Strong First Half Concludes with More Gains in June
HIGHLIGHTS:
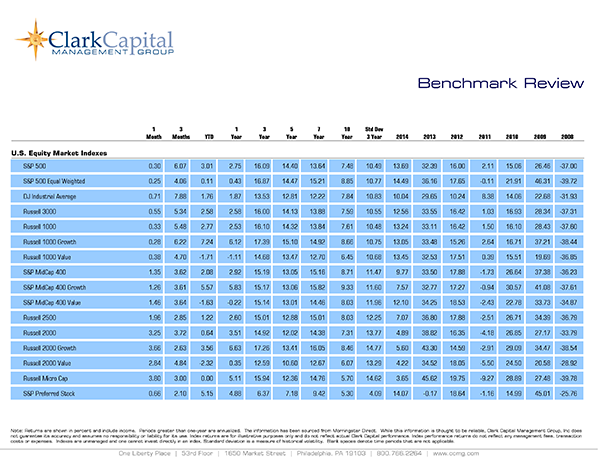
- The S&P 500 and NASDAQ Composite both posted all-time highs in June as stocks trended higher during the month. The Dow Jones Industrial Average was virtually flat, while small-caps advanced, but lagged their large-cap peers.
- For the year to date, the leadership of small, mid-cap and value stocks remained intact. However, growth shined in June and outpaced value.
- The 10-year U.S. Treasury yield slipped lower in June. After closing May at 1.58%, the yield closed June at 1.45% – its lowest closing level since early March. Most bond sectors continued to recover after a rough first quarter.
- The U.S. economy is still solidly recovering, but some economic data points showed that the pace of growth is moderating.
- Vaccines are becoming more widely available and COVID-19 cases have declined dramatically in the U.S. However, some new concerns are rising as the Delta variant begins to spread more widely in the U.S. and globally.
- We expect ongoing economic improvements and progress against the pandemic as we move further into the summer months. Volatility, however, could increase in the months ahead with markets near all-time highs.
EQUITY MARKETS
In a bit of a flashback to 2020, growth stocks rallied strongly in June with the NASDAQ Composite leading the broad equity market indices higher and achieving a new all-time high. The Russell 2000 Index, which has been one of the strongest areas of the market this year, advanced as well in June, but large-caps showed the most strength for the month.
Despite a mid-month spike above 20, volatility generally continued its trend lower in June. The VIX Index closed May below 17 and by the end of June, this index stood below 16. We believe investors should be prepared for ongoing periods of volatility over the next several months with stocks near all-time highs and after such a strong first half of 2021.
Style truly mattered in June, and it was a key driver of returns. However, this time around, growth was the beneficiary as it rallied strongly for the month. Although there will be times when growth rallies, we still believe that the value/growth disparity that reached a peak last year will likely continue to shift in 2021 with value improving on a relative basis. We at Clark Capital continue to use our disciplined approach of seeking out what we believe are high-quality companies with improving business conditions at what we believe are good prices. These types of companies can be found in both the value and growth universe, but the market’s shift to value stocks has benefited our focus on quality companies so far this year.
The numbers for June were as follows: The S&P 500 gained 2.33%, the Dow Jones Industrial Average inched higher by 0.02%, the Russell 3000 advanced 2.47%, the NASDAQ Composite rallied 5.55%, and the Russell 2000 Index, a measure of small-cap stocks, increased 1.94%, and it still leads these indices so far this year. For the year to date, returns in the same order were as follows: 15.25%, 13.79%, 15.11%, 12.92%, and 17.54%, respectively.
We continue to monitor the trend that began to develop in the latter part of 2020 with small-caps and mid-caps outperforming large-caps (as well as value outperforming growth). We believe that this dynamic is likely to continue given the well-above-trend growth expected in the U.S. economy this year and next.
Looking closer at style, the headline Russell 1000 Index gained 2.51% in June. In contrast to May, the Russell 1000 Growth Index rallied 6.27% for the month, while the Russell 1000 Value Index fell -1.15%. For the year to date, the returns were 12.99% and 17.05%, respectively. Value has clearly dominated growth so far in 2021, but that gap narrowed with the returns from last month. The small-cap universe experienced the same sort of month with growth stocks advancing but value stocks declining in June.
International markets have clearly lagged the U.S. so far in 2021, and June was a more muted month of results. The MSCI Emerging Markets Index gained a mere 0.17% in June and the MSCI ACWI ex USA Index, a broad measure of international equities, slipped lower by -0.65%. For the year to date, those two indices show gains of 7.45% and 9.16%, respectively. Following the trend of recent years, U.S. stocks have continued to outperform their international counterparts, but international market results have still been positive so far in 2021.
FIXED INCOME
The yield on the 10-year U.S. Treasury had risen sharply at the beginning of the year. After closing 2020 at 0.93%, the yield surged to 1.74% to close out March. The yield has come off that level and trended lower during the last three months. The yield closed the month of May at 1.58% and it slipped lower in June to 1.45%. Most bond sectors struggled in the first quarter, particularly among the most interest-rate sensitive bonds, but they have been able to recover somewhat from that point.
High yield bonds have been the clear winner in fixed income so far this year, but other pockets of the bond market generally moved higher in June as well. The ongoing and massive support from the Federal Reserve is keeping a lid on interest rates (particularly on the front end of the yield curve) but we did anticipate some steepening of the yield curve would occur in 2021. That steepening has happened, but as is typical, these moves are not made in a steady manner and some back and forth in interest rates should be expected.
Fixed income returns were as follows for June: the Bloomberg Barclays U.S. Aggregate Bond Index gained 0.70%, the Bloomberg Barclays U.S. Credit Index advanced 1.50%, the Bloomberg Barclays U.S. Corporate High Yield Index rose 1.34% and the Bloomberg Barclays Municipal Index gained 0.27%. For the year to date, those index returns in the same order were as follows: -1.60%, -1.28%, 3.62%, and 1.06%, respectively.
Longer dated U.S. Treasuries also enjoyed gains for the month as the 10 and 30-year indices advanced, but the 3 and 5-year indices declined in June. U.S. Treasuries are down across the board year to date. Treasury Inflation-Protected Securities (TIPS) are the exception in Treasuries and have been one of the stronger pockets of the bond market recently as inflation concerns and expectations have increased. For the month, the Bloomberg Barclays U.S. Treasury TIPS Index gained 0.61%, and it is up 3.25% over the last three months. We continue to maintain our long-standing position favoring credit versus pure rate exposure in this interest rate environment.
ECONOMIC DATA AND OUTLOOK
Job market gains improved in May compared to April, but they were still below expectations. Non-farm payroll additions totaled 559,000 in May, easily surpassing the 278,000 jobs created in April, but below expectations of 675,000. However, the unemployment rate fell to 5.8%, which was better than anticipated and is the lowest mark since prior to the pandemic. Job openings surged once again to over 9.28 million in April, more than 1 million openings higher than expected.
Job gains, while strong, have been below expectations at a time when job openings soar to record highs. We believe that one of the causes for this disconnect is that unemployment benefits were expanded to help people through the pandemic and as many of those programs remain, the incentive to find a job has not been as pronounced. Many states have begun to end those expanded benefits as employers have numerous jobs to fill. We believe that more workers will move back into the job market as some of the extended benefits begin to expire.
The housing market is still posting strong numbers, but it too has some imbalances in supply and demand. Home prices have risen dramatically (up 14.88% in April based on the year-over year-reading of the S&P CoreLogic CS 20-City Index), so some buyers are being priced out of the market. Demand is outpacing supply at this point and home prices are rising sharply. Existing and new home sales both fell in May from April. Housing starts were below expectations, but they did improve from the prior month.
Building permits missed expectations as well in May and were lower than April’s pace. We will continue to monitor how rising home prices and low supply impact housing market progress in 2021. The housing market has been a clear source of strength during the economic recovery and has historically been a good leading indicator for the economy.
The widely followed ISM Manufacturing Index for May was at 61.2, which exceeded expectations and showed improvement from April. The ISM Non-Manufacturing Index, which covers the much larger service industries in the U.S. economy, came in at 64.0 – ahead of expectations of 63.2 and the prior month’s reading of 62.7. Manufacturing and service industries have improved from the shutdown period and continue to show solid growth as the economy recovers, but some of the data is showing that growth is moderating. Recall that ISM readings above 50 indicate expansion and below 50 signal contraction, so these current readings remain in very strong growth territory.
Retail sales (ex. auto and gas) declined in May by -0.8% when expectations were calling for no change for the month. However, the prior month’s originally reported decline of -0.8% was revised to show a modest monthly gain of 0.1%. The Conference Board’s Leading Index gained 1.3% in May as expected. Finally, the third and final reading of first quarter 2021 GDP was unchanged from the prior estimate of a 6.4% annualized growth rate.
The Fed has been unwavering in its commitment to support the proper functioning of the financial system. However, the Fed now finds itself having to comment on rising inflation readings over the last few months. The headline Consumer Price Index (CPI) was up 5.0% on a year-over-year basis in May and the core reading of CPI, which excludes more volatile food and energy prices, was up a 3.8% for those twelve months. The Fed believes that much of the move higher in prices is transitory and due to the economic reopening.
However, the market is watching closely any commentary from that Fed that deals with the tapering of its bond purchases and the eventual time frame when the Fed will raise rates. At the FOMC meeting in June, the Fed raised its inflation expectations to 3.4% for 2021 from 2.4%, but maintained the idea that inflation will move closer to the 2% policy objective in the next few years. It will be important to monitor how Fed officials talk about or react to some mounting concern about inflation. Chairman Powell continues to indicate that it is too soon to begin tapering or even think about raising policy rates, and he has tried to assure the market that the Fed will give ample warning before it goes down that path.
We remain resolute in our belief that the U.S. economy and corporate America will continue to recover as we progress through this pandemic period and vaccines become more widely available. Overall, we believe the economy and financial markets are heading in the right direction. As always, we continue to believe it is imperative for investors to stay focused on their long-term goals and not let short-term swings in the market derail them from their longer-term objectives. As we head into the traditionally slower summer months with major stock indices near all-time highs and with the recent emergence of the Delta variant, investors should be prepared for more volatility as we move further into the summer.
INVESTMENT IMPLICATIONS
Clark Capital’s Top-Down, Quantitative Strategies
The markets continued trading higher in June, capping one of the best first half of the year gains for the market this century. The S&P 500 closed the month in record territory, gaining 2.33% during June. Leadership shifted again with growth outperforming value during the month, but value still has the edge year to date.
Credit has remained very firm and supportive of the market backdrop with continued economic reopening, strong economic growth, and a benign default environment. The massive amount of liquidity continues to find a home in risk assets across equity and credit.
Clark Capital’s Bottom-Up, Fundamental Strategies
At the June FOMC meeting, the Federal Reserve acknowledged the rising inflation pressures and began discussing tapering the purchase of securities sooner than expected. That pushed investors dramatically away from value, cyclicals, small-caps, and international stocks and instead towards large-cap growth.
Ultimately, a reversal in Central Bank easing has lowered the expectations of future economic growth, which drove 10-year Treasury yields to 1.45%.
ECONOMIC DATA
| Event | Period | Estimate | Actual | Prior | Revised |
|---|---|---|---|---|---|
| ISM Manufacturing | May | 61 | 61.2 | 60.7 | — |
| ISM Services Index | May | 63.2 | 64 | 62.7 | — |
| Change in Nonfarm Payrolls | May | 675k | 559k | 266k | 278k |
| Unemployment Rate | May | 5.90% | 5.80% | 6.10% | — |
| Average Hourly Earnings YoY | May | 1.60% | 2.00% | 0.30% | 0.40% |
| JOLTS Job Openings | Apr | 8200k | 9286k | 8123k | 8288k |
| PPI Final Demand MoM | May | 0.50% | 0.80% | 0.60% | — |
| PPI Final Demand YoY | May | 6.20% | 6.60% | 6.20% | — |
| PPI Ex Food and Energy MoM | May | 0.50% | 0.70% | 0.70% | — |
| PPI Ex Food and Energy YoY | May | 4.80% | 4.80% | 4.10% | — |
| CPI MoM | May | 0.50% | 0.60% | 0.80% | — |
| CPI YoY | May | 4.70% | 5.00% | 4.20% | — |
| CPI Ex Food and Energy MoM | May | 0.50% | 0.70% | 0.90% | — |
| CPI Ex Food and Energy YoY | May | 3.50% | 3.80% | 3.00% | — |
| Retail Sales Ex Auto and Gas | May | 0.00% | -0.80% | -0.80% | 0.10% |
| Industrial Production MoM | May | 0.70% | 0.80% | 0.70% | 0.10% |
| Building Permits | May | 1730k | 1681k | 1760k | 1733k |
| Housing Starts | May | 1630k | 1572k | 1569k | 1517k |
| New Home Sales | May | 865k | 769k | 863k | 817k |
| Existing Home Sales | May | 5.73m | 5.80m | 5.85m | — |
| Leading Index | May | 1.30% | 1.30% | 1.60% | 1.30% |
| Durable Goods Orders | May P | 2.80% | 2.30% | -1.30% | -0.80% |
| GDP Annualized QoQ | 1Q T | 6.40% | 6.40% | 6.40% | — |
| U. of Mich. Sentiment | June P | 84.2 | 86.4 | 82.9 | — |
| Personal Income | May | -2.50% | -2.00% | -13.10% | — |
| Personal Spending | May | 0.40% | 0.00% | 0.50% | 0.90% |
| S&P CoreLogic CS 20-City YoY NSA | Apr | 14.70% | 14.88% | 13.27% | 13.36% |
Source: Bloomberg
Past performance is not indicative of future results. The views expressed are those of the author(s) and do not necessarily reflect the views of Clark Capital Management Group. The opinions referenced are as of the date of publication and are subject to change due to changes in the market or economic conditions and may not necessarily come to pass. Nothing herein should be construed as a solicitation, recommendation or an offer to buy, sell or hold any securities, other investments or to adopt any investment strategy or strategies. Investors must make their own decisions based on their specific investment objectives and financial circumstances. Investing involves risk, including loss of principal.
Clark Capital Management Group reserves the right to modify its current investment strategies and techniques based on changing market dynamics or client needs. It should not be assumed that any of the investment recommendations or decisions we make in the future will be profitable.
Clark Capital Management Group is an investment adviser registered with the U.S. Securities and Exchange Commission. Registration does not imply a certain level of skill or training. More information about Clark Capital Management Group’s advisory services can be found in its Form ADV which is available upon request.
Fixed income securities are subject to certain risks including, but not limited to: interest rate (changes in interest rates may cause a decline in market value or an investment), credit, prepayment, call (some bonds allow the issuer to call a bond for redemption before it matures), and extension (principal repayments may not occur as quickly as anticipated, causing the expected maturity of a security to increase).
Non-investment-grade debt securities (high-yield/junk bonds) may be subject to greater market fluctuations, risk of default or loss of income and principal than higher-rated securities.
Foreign securities are more volatile, harder to price and less liquid than U.S. securities. They are subject to different accounting and regulatory standards and political and economic risks. These risks are enhanced in emerging market countries.
The value of investments, and the income from them, can go down as well as up and you may get back less than the amount invested.
The Bloomberg Barclays U.S. Municipal Index covers the USD-denominated long-term tax exempt bond market. The index has four main sectors: state and local general obligation bonds, revenue bonds, insured bonds and prerefunded bonds.
The Dow Jones Industrial Average indicates the value of 30 large, publicly owned companies based in the United States.
The NASDAQ Composite is a stock market index of the common stocks and similar securities listed on the NASDAQ stock market.
The S&P 500 measures the performance of the 500 leading companies in leading industries of the U.S. economy, capturing 75% of U.S. equities. .
The Russell 1000 Growth Index measures the performance of the large-cap growth segment of the U.S. equity universe. It includes those Russell 1000 Index companies with higher price-to-book ratios and higher forecasted growth values.
Russell 1000 Index measures the performance of the 1,000 largest companies in the Russell 3000 Index, which represents approximately 92% of the total market capitalization of the Russell 3000 Index.
The Russell 1000 Value Index measures the performance of the large-cap value segment of the U.S. equity universe. It includes those Russell 1000 Index companies with lower price-to-book ratios and lower forecasted growth values.
The Russell 2000 Index is a small-cap stock market index that represents the bottom 2,000 stocks in the Russell 3000.
The Russell 3000 Index measures the performance of the 3,000 largest U.S. companies based on total market capitalization, which represents approximately 98% of the investable U.S. equity market.
The 10 Year Treasury Rate is the yield received for investing in a US government issued treasury security that has a maturity of 10 year. The 10 year treasury yield is included on the longer end of the yield curve. Many analysts will use the 10 year yield as the “risk free” rate when valuing the markets or an individual security.
Bloomberg Barclays U.S. Aggregate Bond Index: The index is unmanaged and measures the performance of the investment grade, U.S. dollar denominated, fixed-rate taxable bond market, including Treasuries and government-related and corporate securities that have a remaining maturity of at least one year.
The Bloomberg Barclays U.S. Corporate High-Yield Index covers the U.S. dollar-denominated, non-investment grade, fixed-rate, taxable corporate bond market. Securities are classified as high-yield if the middle rating of Moody’s, Fitch, and S&P is Ba1/BB+/BB+ or below.
The Bloomberg Barclays U.S. Credit Index measures the investment grade, U.S. dollar denominated, fixed-rate taxable corporate and government related bond markets.
The ISM Non-Manufacturing Index is an index based on surveys of more than 400 non-manufacturing firms’ purchasing and supply executives, within 60 sectors across the nation, by the Institute of Supply Management (ISM). The ISM Non-Manufacturing Index tracks economic data, like the ISM Non-Manufacturing Business Activity Index. A composite diffusion index is created based on the data from these surveys, that monitors economic conditions of the nation.
ISM Manufacturing Index measures manufacturing activity based on a monthly survey, conducted by Institute for Supply Management (ISM), of purchasing managers at more than 300 manufacturing firms.
Personal consumption expenditures price index is the component statistic for consumption in gross domestic product collected by the United States Bureau of Economic Analysis.
The Consumer Price Index (CPI) measures the change in prices paid by consumers for goods and services.
The MSCI Emerging Markets Index captures large and mid cap representation across 27 Emerging Markets (EM) countries.
The MSCI ACWI ex USA Index captures large and mid cap representation across 22 of 23 Developed Markets (DM) countries (excluding the US) and 27 Emerging Markets (EM) countries*. With 2,359 constituents, the index covers approximately 85% of the global equity opportunity set outside the US.
The S&P CoreLogic Case-Shiller 20-City Composite Home Price NSA Index seeks to measures the value of residential real estate in 20 major U.S. metropolitan areas
The Bloomberg Barclays US Treasury Index measures US dollar-denominated, fixed-rate, nominal debt issued by the U.S. Treasury.
The CBOE Volatility Index, known by its ticker symbol VIX, is a popular measure of the stock market’s expectation of volatility implied by S&P 500 index options.
The Conference Board’s Leading Indexes are the key elements in an analytic system designed to signal peaks and troughs in the business cycle. The leading, coincident, and lagging economic indexes are essentially composite averages of several individual leading, coincident, or lagging indicators. They are constructed to summarize and reveal common turning point patterns in economic data in a clearer and more convincing manner than any individual component – primarily because they smooth out some of the volatility of individual components.
The volatility (beta) of a client’s portfolio may be greater or less than its respective benchmark. It is not possible to invest in these indices.
Index returns include the reinvestment of income and dividends. The returns for these unmanaged indexes do not include any transaction costs, management fees or other costs. It is not possible to make an investment directly in any index.
CCM-993
![]()