Markets Continue Higher as the Economic Reopening Begins
HIGHLIGHTS:
- U.S. stocks pushed higher in May after April enjoyed the third best month of returns for the S&P 500 since WWII.
- Volatility, as measured by the VIX Index, continued to decline. While still elevated, the VIX closed May at 27.51, significantly lower than the all-time closing high above 80 in mid-March.
- The 10-year U.S. Treasury yield stayed in a rather tight and subdued range for the month. The 10-year yield closed May at 0.65% after closing April at 0.64%.
- By the end of May, every state was at some stage in the reopening process. We expect the economic recovery to be long and uneven, but the initial results are showing some positive signs.
EQUITY MARKETS
The CBOE Volatility Index, or VIX Index, hit a record high during March. By the close of May, the VIX declined to levels that were last seen in February as COVID-19 fears were just starting to build. The VIX had spent most of January and the first half of February in the low to mid-teens, so in the upper 20s, the VIX remains comparably high to pre-COVID-19 and historic levels. We anticipate that volatility will remain elevated for the next few months as the reopening process moves forward in what we expect to be a long and uneven economic recovery. Furthermore, broader uncertainty has manifested in the U.S. as political and social issues have come to the forefront in recent weeks and a presidential election looms in November.
The recent market moves have shown some modest signs of a broadening rally. However, growth has still dominated value as it has during much of the post-credit crisis period. We believe there will be more “winners and losers” from a market perspective as we transition through this economic reopening phase. We at Clark Capital continue to use our disciplined approach of seeking out high-quality businesses at what we believe are good prices. As always, we will continue to make purposeful investments in both stocks and bonds as we move forward in what we believe will be a period of wider outcomes of investment results.
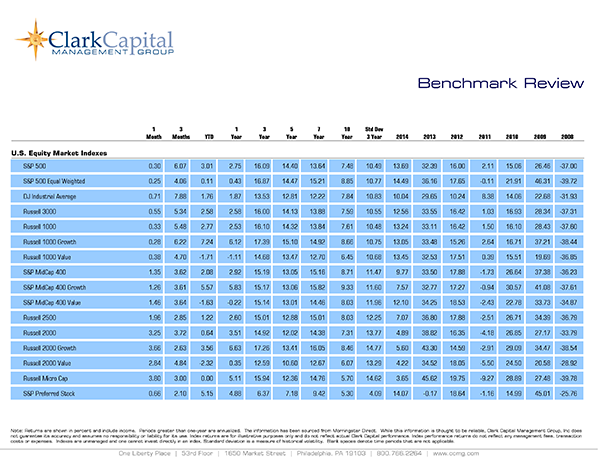
The numbers for May were as follows: The S&P 500 gained 4.76%, the Dow Jones Industrial Average improved by 4.66%, the Russell 3000 advanced 5.35%, the NASDAQ Composite rallied 6.89% and the Russell 2000 Index, a measure of small-cap companies, gained by 6.51%. Significant divergences still exist among U.S. equity indices on a year-to-date basis and those results through May were: -4.97%, -10.06%, -5.63%, +6.22%, and -15.95%, respectively.
The largest cap growth companies are still dominating performance year to date, but some modest broadening has occurred in the markets over the last couple of months. Since the market lows on March 23, and for the second quarter to date, both the equal-weighted S&P 500 Index and small-cap stocks have outpaced the market-cap weighted S&P 500 Index returns (the way the index is normally presented). In particular, the Russell 2000 index has rallied 21.14% over the last two months as the S&P 500 gained 18.19% in April and May. Needless to say, both indices show impressive results, but the outperformance of small caps might be signaling that the market rally is broadening after large-cap growth stocks have outpaced other equities.
While we have seen some broadening from a market cap perspective, growth stocks have continued to outperform value stocks dramatically for the month and year to date. The large-cap and value focused Russell 1000 Value Index advanced 3.43% compared to the Russell 1000 Growth Index, which gained 6.71% in May. Year-to-date results have widened even further with the former index down -15.70% through the first five months of the year and the latter index showing a gain of 5.23%..
International equities advanced in May as well, but results lagged U.S. stocks. Emerging market equities, as measured by the MSCI Emerging Markets Index, were only marginally higher for the month and trailed most other equities with a gain of only 0.77%. The MSCI ACWI ex USA Index, a broad measure of international equities, advanced 3.27% for the month. Both international indices have underperformed U.S. stocks year to date with declines of -15.96% and -14.85%, respectively.
FIXED INCOME
Massive support from the Federal Reserve helped improve market liquidity and, while not back to normal, bond market functioning began to improve in April and May. After a clear flight to quality into U.S. Treasuries in the first quarter, corporate bonds and municipals have outperformed so far in the second quarter as credit spreads have narrowed.
U.S. Treasury yields stayed subdued in May and the yield on the 10-year U.S. Treasury was rangebound during the month. After closing April at 0.64%, the 10-year yield closed May at 0.65% with the high and the low yield range during the month a mere 10 basis points between 0.63% and 0.73%. The yield curve became steeper as the 30-year yield moved from 1.28% to 1.41% from the end of April to the end of May.
Fixed income returns were as follows for May: the Bloomberg Barclays U.S. Aggregate Bond Index gained 0.47%, the Bloomberg Barclays U.S. Credit Index advanced 1.63%, and the Bloomberg Barclays U.S. Corporate High Yield Index rose 4.41%. For the year-to-date, those index results were as follows: a gain of 5.47%, 2.94% and a decline of -4.73%, respectively. Municipal bonds were among the best performers in fixed income for the month, trailing only high-yield bonds. The Bloomberg Barclays U.S. Treasury index slipped lower by -0.25% for the month, but still rose an impressive 8.61% year to date.
ECONOMIC DATA AND OUTLOOK
As mentioned earlier, we believe the economic recovery will be long and uneven as we move through the reopening process and to the other side of this pandemic. We are going through what we believe will be the worst economic period of the crisis in this current quarter. Much of the economic data now being released is bearing the full brunt of the self-imposed economic shutdown.
The impact of the shutdown in the economy in March reverberated through the first quarter GDP reading, which now reflects a -5.0% annualized decline in activity. Remember, this sharp decline occurred even as the U.S. economy started the year strongly and the global economy was picking up momentum before the pandemic-driven economic shutdown started to take place in March. We expect second quarter GDP in the U.S. to decline far worse than it did in the first quarter and to be the weakest period of the COVID-19 crisis. It is important to remember that this data lags, as the worst month was likely April and second quarter GDP will not be reported until the end of July.
In April, the widely followed ISM Manufacturing Index fell to 41.5, a sharp drop from the prior month’s reading of 49.1, but ahead of estimates of 36.0. Particularly weak, the ISM New Orders component of this index fell more than expected to 27.1 from the already depressed level of 42.2 in March. The ISM Non-Manufacturing Index, which covers the much larger service industries in the U.S. economy, fell over 10 points to 41.8 in April from 52.5 in March, but it too was better than the expected decline to 38.0. Recall, readings below 50 indicate contraction for the ISM indices.
With the full brunt of layoffs hitting in April, the decline in payroll data was historic. Non-farm payrolls fell by over 20.5 million in April, which pushed the unemployment rate up by more than 10 percentage points to 14.7% from the prior month’s mark of 4.4%. Average hourly earnings showed strong gains in April, but this reflected lower-paid workers being hit the hardest by layoffs due to COVID-19. As would be expected during this extraordinary time, consumer spending fell dramatically in April. Retail sales, ex. autos and gas, dropped 16.2% during the month, more than twice the anticipated drop of -7.6%. Personal spending fell -13.6% in April, which was also more than expected. We will pay close attention to how quickly those recently unemployed get back to work as the economy reopens.
Housing starts fell by -30.2% in April to an annualized rate of 891,000, and building permits dropped by -20.8% to an annualized rate of 1.074 million. Existing home sales fell sharply as well by -17.8% as sellers pulled home listings and normal buying and selling activity slowed dramatically. However, a point of good news, new home sales unexpectedly picked up fractionally in April to an annualized rate of 623,000. Expectations were calling for a much slower pace of sales of 480,000 and a drop from the prior month’s level of 619,000.
The Federal Reserve continues to signal an “all-in” attitude to try to support the functioning of the financial system. Clearly, the Fed’s aggressive support to help combat this crisis has been an important factor in the recent improvements in the capital markets. Unfortunately, and not unexpectedly (especially in an election year), the next round of fiscal stimulus is more uncertain at this point. Both parties seem to agree that another round of fiscal stimulus will be needed, but the divide between their two approaches is wide at this point.
As we go through what we know are difficult and challenging times, we remain resolute in our belief that the U.S. economy and corporate America will make it through this pandemic. This stance has not changed since the beginning of the crisis. While we expect an uneven and long economic recovery, we would not and do not bet against the resiliency of the U.S. economy, corporate America, and U.S. citizens to get through this challenging period. Remember, stocks are forward looking, and the market appears to be looking beyond the current and pending weak economic and earnings news. To be clear, we do expect elevated volatility in the weeks and months ahead and we think it is important that investors brace for this likely bumpy path. However, at this point, we believe the economy and markets are heading in the right direction.
We believe it is imperative for investors to stay focused on their long-term goals and not let short-term swings in the market derail them from their longer-term objectives. That discipline served clients well over the last few months as most areas of stocks and bonds improved dramatically from their March lows.
INVESTMENT IMPLICATIONS
Clark Capital’s Top-Down, Quantitative Strategies
The markets continued to favor a risk-on bias throughout May with both equities and credit advancing. The Navigator® Style Opportunity portfolio favored large-cap growth and large-caps for much of 2019, through the decline, and then the rally. We are finally starting to see participation broaden out with mid and small-caps on the rise. We have added to mid-cap and small-cap growth positions to the portfolio to capture the broadening trends.
In the past few weeks, credit has benefitted from the Fed’s Credit Facility backstops with both investment grade and below investment grade debt hitting new recovery highs. High yield bond spreads have compressed to 637 basis points, a strong improvement from the 1100 bps spread at the depth of the declines in March.
Clark Capital’s Bottom-Up, Fundamental Strategies
As investors shifted focus from the current “COVID-19 quarantine” recession to the “getting-back-to-work” recovery, equity prices continued to advance smartly in May.
While longer term U.S. Treasury interest rates remained stable, declining credit spreads and volatility enabled investors to expand their appetite beyond the safety of large-cap growth, thus market participation broadened out. As a result, The Navigator® All-Cap portfolio reduced its weight in large-cap exposure to 63% of the portfolio and increased mid/small-cap exposure.
The Navigator® High Dividend Equity portfolio’s focus on dividend growth saw it benefit from the economically sensitive sectors, with consumer discretionary, energy and financials as the largest contributing sectors. Detractors included health care, communication services and industrials.
| Event | Period | Estimate | Actual | Prior | Revised |
|---|---|---|---|---|---|
| ISM Manufacturing | Apr | 36 | 41.5 | 49.1 | — |
| ISM Non-Manf. Composite | Apr | 38 | 41.8 | 52.5 | — |
| Change in Nonfarm Payrolls | Apr | -22.0m | -20.537m | -701k | -881k |
| Unemployment Rate | Apr | 16.00% | 14.70% | 4.40% | — |
| Average Hourly Earnings YoY | Apr | 3.30% | 7.90% | 3.10% | 3.30% |
| JOLTS Job Openings | Mar | 5800k | 6191k | 6882k | 7004k |
| PPI Final Demand MoM | Apr | -0.50% | -1.30% | -0.20% | — |
| PPI Final Demand YoY | Apr | -0.40% | -1.20% | 0.70% | — |
| PPI Ex Food and Energy MoM | Apr | -0.10% | -0.30% | 0.20% | — |
| PPI Ex Food and Energy YoY | Apr | 0.80% | 0.60% | 1.40% | — |
| CPI MoM | Apr | -0.80% | -0.80% | -0.40% | — |
| CPI YoY | Apr | 0.40% | 0.30% | 1.50% | — |
| CPI Ex Food and Energy MoM | Apr | -0.20% | -0.40% | -0.10% | — |
| CPI Ex Food and Energy YoY | Apr | 1.70% | 1.40% | 2.10% | — |
| Retail Sales Ex Auto and Gas | Apr | -7.60% | -16.20% | -3.10% | -2.60% |
| Industrial Production MoM | Apr | -12.00% | -11.20% | -5.40% | -4.50% |
| Building Permits | Apr | 1000k | 1074k | 1353k | 1356k |
| Housing Starts | Apr | 900k | 891k | 1216k | 1276k |
| New Home Sales | Apr | 480k | 623k | 627k | 619k |
| Existing Home Sales | Apr | 4.22m | 4.33m | 5.27m | — |
| Leading Index | Apr | -5.40% | -4.40% | -6.70% | -7.40% |
| Durable Goods Orders | Apr P | -19.00% | -17.20% | -14.70% | -16.60% |
| GDP Annualized QoQ | 1Q S | -19.00% | -17.20% | -14.70% | -16.60% |
| U. of Mich. Sentiment | May P | 68 | 73.7 | 71.8 | — |
| Personal Income | Apr | -5.90% | 10.50% | -2.00% | -2.20% |
| Personal Spending | Apr | -12.80% | -13.60% | -7.50% | -6.90% |
| S&P CoreLogic CS 20-City YoY NSA | Mar | 3.44% | 3.92% | 3.47% | 3.52% |
Source: Bloomberg
Past Performance is indicative of future results. The opinions expressed are those of the Clark Capital Management Group portfolio manager(s) that manage the strategies or products discussed herein, and do not necessarily reflect the opinions of all portfolio managers at Clark Capital Management Group or the firm as a whole. The opinions referenced are as of the date of publication and are subject to change due to changes in the market or economic conditions and may not necessarily come to pass. Nothing herein should be construed as a solicitation, recommendation or an offer to buy, sell or hold any securities, other investments or to adopt any investment strategy or strategies.
There is no guarantee of the future performance of any Clark Capital investment portfolio. This is not financial advice or an offer to sell any product. Clark Capital Management Group reserves the right to modify its current investment strategies and techniques based on changing market dynamics or client needs. It should not be assumed that any of the investment recommendations or decisions we make in the future will be profitable or will equal the investment performance of the securities discussed herein. Clark Capital Management Group is an investment adviser registered with the U.S. Securities and Exchange Commission. Registration does not imply a certain level of skill or training. More information about Clark Capital Management Group’s advisory services can be found in its Form ADV which is available upon request.
Fixed income securities are subject to certain risks including, but not limited to: interest rate (changes in interest rates may cause a decline in market value or an investment), credit, prepayment, call (some bonds allow the issuer to call a bond for redemption before it matures), and extension (principal repayments may not occur as quickly as anticipated, causing the expected maturity of a security to increase).
Non-investment-grade debt securities (high-yield/junk bonds) may be subject to greater market fluctuations, risk of default or loss of income and principal than higher-rated securities.
Foreign securities are more volatile, harder to price and less liquid than U.S. securities. They are subject to different accounting and regulatory standards and political and economic risks. These risks are enhanced in emerging market countries.
The Dow Jones Industrial Average indicates the value of 30 large, publicly owned companies based in the United States.
The NASDAQ Composite is a stock market index of the common stocks and similar securities listed on the NASDAQ stock market.
The S&P 500 measures the performance of the 500 leading companies in leading industries of the U.S. economy, capturing 75% of U.S. equities. .
The Russell 1000 Growth Index measures the performance of the large-cap growth segment of the U.S. equity universe. It includes those Russell 1000 Index companies with higher price-to-book ratios and higher forecasted growth values.
The Russell 1000 Value Index measures the performance of the large-cap value segment of the U.S. equity universe. It includes those Russell 1000 Index companies with lower price-to-book ratios and lower forecasted growth values.
The Russell 2000 Index is a small-cap stock market index that represents the bottom 2,000 stocks in the Russell 3000.
The Russell 3000 Index measures the performance of the 3,000 largest U.S. companies based on total market capitalization, which represents approximately 98% of the investable U.S. equity market.
The 10 Year Treasury Rate is the yield received for investing in a US government issued treasury security that has a maturity of 10 year. The 10 year treasury yield is included on the longer end of the yield curve. Many analysts will use the 10 year yield as the “risk free” rate when valuing the markets or an individual security. The 30 Year Treasury Rate is the yield received for investing in a US government issued treasury security that has a maturity of 30 years. The 30 year treasury yield is included on the longer end of the yield curve and is important when looking at the overall US economy
The MSCI Emerging Markets Index is used to measure large and mid-cap equity market performance in the global emerging markets.
The MSCI ACWI ex USA Index captures large and mid-cap representation across 22 of 23 developed market countries and 24 emerging market countries, covering approximately 85% of the global equity opportunity set outside of the U.S.
The Bloomberg Barclays US Treasury Index measures US dollar-denominated, fixed-rate, nominal debt issued by the U.S. Treasury.
Bloomberg Barclays U.S. Aggregate Bond Index: The index is unmanaged and measures the performance of the investment grade, U.S. dollar denominated, fixed-rate taxable bond market, including Treasuries and government-related and corporate securities that have a remaining maturity of at least one year.
The Bloomberg Barclays U.S. Corporate High-Yield Index covers the U.S. dollar-denominated, non-investment grade, fixed-rate, taxable corporate bond market. Securities are classified as high-yield if the middle rating of Moody’s, Fitch, and S&P is Ba1/BB+/BB+ or below.
The Bloomberg Barclays U.S. Credit Index measures the investment grade, U.S. dollar denominated, fixed-rate taxable corporate and government related bond markets.
The Bloomberg Barclays 30-Year U.S. Treasury Index is a universe of Treasurybonds, and used as a benchmark against the market for long-term maturityfixed-income securities. The index assumes reinvestment of all distributionsand interest payments..
The ISM Non-Manufacturing Index is an index based on surveys of more than 400 non-manufacturing firms’ purchasing and supply executives, within 60 sectors across the nation, by the Institute of Supply Management (ISM). The ISM Non-Manufacturing Index tracks economic data, like the ISM Non-Manufacturing Business Activity Index. A composite diffusion index is created based on the data from these surveys, that monitors economic conditions of the nation.
ISM Manufacturing Index measures manufacturing activity based on a monthly survey, conducted by Institute for Supply Management (ISM), of purchasing managers at more than 300 manufacturing firms.
Personal consumption expenditures price index is the component statistic for consumption in gross domestic product collected by the United States Bureau of Economic Analysis.
The CBOE Volatility Index, known by its ticker symbol VIX, is a popular measure of the stock market’s expectation of volatility implied by S&P 500 index options.
The volatility (beta) of a client’s portfolio may be greater or less than its respective benchmark. It is not possible to invest in these indices.
Index returns include the reinvestment of income and dividends. The returns for these unmanaged indexes do not include any transaction costs, management fees or other costs. It is not possible to make an investment directly in any index.
CCM-993
![]()