Navigating Changing Tides
Highlights
We believe:
- The economy ended 2022 on a strong note, advancing in the second half of the year despite negative growth in the first half. Economic momentum is likely to carry into early 2023, but growth may weaken in Q2 and Q3.
- The odds of at least a mild recession are increasing for the 2nd half of 2023. We expect the economy to grow only 0.5% in the new year.
- It is rare for the S&P 500 to post back-to-back years of negative returns. High yield bond losses in 2022 suggest a positive roadmap for stocks and high yield bonds in 2023. S&P 500 target of 4200.
- Inflation is set to continue moderating and could well be near the Fed’s target in the 2nd half of the year.
- The Federal Reserve is in the late innings of rate hikes. We expect the final rate hikes to occur in Q1, then pause.
- The yield curve should steepen as the market prices in the end of the tightening cycle. Credit and duration should rebound from a miserable 2022.
- Risks to the outlook include: Federal Reserve policy error, recession, earnings revision cycle/negative earnings growth, and geopolitics.
Good Riddance to 2022!
The major equity indices peaked on the first trading day of the year, and the positive correlations between stocks and bonds provided no place to hide. For the first time on record, both stocks and bonds fell by more than 10%. In fact, 2022 was the worst year for the traditional 60%/40% balanced portfolio since the 1930s. As shown in the table below in Figure 1, the S&P 500 declined by 18.13%, its seventh worst year since 1926. Bonds didn’t fare much better. The Bloomberg Barclays U.S. Aggregate Bond Index lost 13.01%, its worst year on record, and the Bloomberg Barclays High Yield Index dropped 11.19%, its second largest decline ever.
Figure 1. | Perspective
| Domestic Equity | 2019 – 2021 | 2022 | 2019 – 2022 |
|---|---|---|---|
| S&P 500 | 100.29% | -18.13% | 63.98% |
| Russell 1000 | 100.97% | -19.14% | 62.50% |
| Russell 2000 | 72.75% | -20.46% | 37.40% |
| Russell 3000 | 98.96% | -19.22% | 60.71% |
| Russell 1000 Value | 62.71% | -7.56% | 50.40% |
| Russell 1000 Growth | 141.00% | -29.14% | 70.77% |
| International Equity | 2019 – 2021 | 2022 | 2019 – 2022 |
|---|---|---|---|
| MSCI Emerging Market | 36.54% | -20.09% | 9.11% |
| MSCI All Country World (ex US) | 44.97% | -16.00% | 21.77% |
| Fixed Income | 2019 – 2021 | 2022 | 2019 – 2022 |
|---|---|---|---|
| BBgBarc U.S. Aggregate Bond | 15.08% | -13.01% | 0.10% |
| BBgBarc U.S. Treasury | 12.73% | -12.46% | -1.32% |
| BBgBarc U.S. Corporate | 24.55% | -15.76% | 4.92% |
| BBgBarc U.S. Corporate High Yield | 28.91% | -11.19% | 14.49% |
| BBgBarc Municipal | 14.86% | -8.53% | 5.06% |
Drivers of market weakness included risks that we called out in last year’s Market Outlook: the highest inflation and most aggressive tightening cycle by the Federal Reserve in 40 years, a first half economic slowdown, and supply chain issues exacerbated by the Russia/Ukraine war.
In 2021, the Fed was too complacent about surging inflation, and they spent all of 2022 playing catch-up, and potentially hiking rates too much into peaking inflation. For perspective, at the end of 2021, the Fed Funds rate was 0.25% and the 10-Year Treasuries Note yield was just 1.51%. One year later, the Fed Funds rate is 4.50% and the 10-Year Treasury Note yield is 3.88%. Assets across the board suffered due to repricing the cost of money. Most of the major U.S. equity indices suffered double-digit losses, with the S&P 500 losing 18%. Lower duration indices like the Russell 1000 Value Index (-7.56%) and MSCI All Country World Index (ex US) (-16.0%) declined less while higher duration indices like the Russell 1000 Growth Index (-29.1%) and Russell 2000 Index (-20.5%) fell the most.
It wasn’t long ago that a topic many were talking about was the potential for negative nominal rates in the U.S. That is not a consideration now with the backup in yields we saw in 2022. By many accounts, it was the worst bond market in history. Duration underperformed credit with Treasuries and investment grade corporate debt suffering the worst of the losses.
We certainly are living in interesting times for the markets. When 2022 began, we had just enjoyed a three-year stretch of better than 20% annualized returns for the major U.S. equity indices. Despite the losses experienced last year, the four-year annualized return for the S&P 500 is 13.2%. As my grandfather used to say, “that is nothing to shake a stick at.”
Macro Headwinds May Turn Into Tailwinds
As we enter 2023, consensus expectations are calling for a recession and more pain for the markets. A lot of the macro headwinds still exist today, but as the year progresses, we believe those headwinds could turn into tailwinds. Therefore, we have a bit more of an optimistic view of the potential for the markets in 2023. The economy ended last year on a strong note with solid second half growth. That momentum is likely to carry over into early this year, but we believe growth will moderate from there.
On the positive side, a strong labor market and falling inflation should support continued growth. However, economic indicators including Leading Indicators, inverted yield curves, manufacturing indices, housing weakness, and the cumulative effect of monetary tightening suggest the odds of at least a mild recession are increasing. We expect the economy to grow by only 0.5% in 2023, and place 50% odds on a mild recession.
The range of potential outcomes for the equity market is wide this year, and largely hinge on the occurrence and severity of any recession. In our opinion, while a soft landing is not out of the question, the odds of at least a mild recession are increasing for the second half of 2023. If there is a recession in 2023, we believe it would be mild given the strength of the labor market and lack of excesses that have built up in the system.
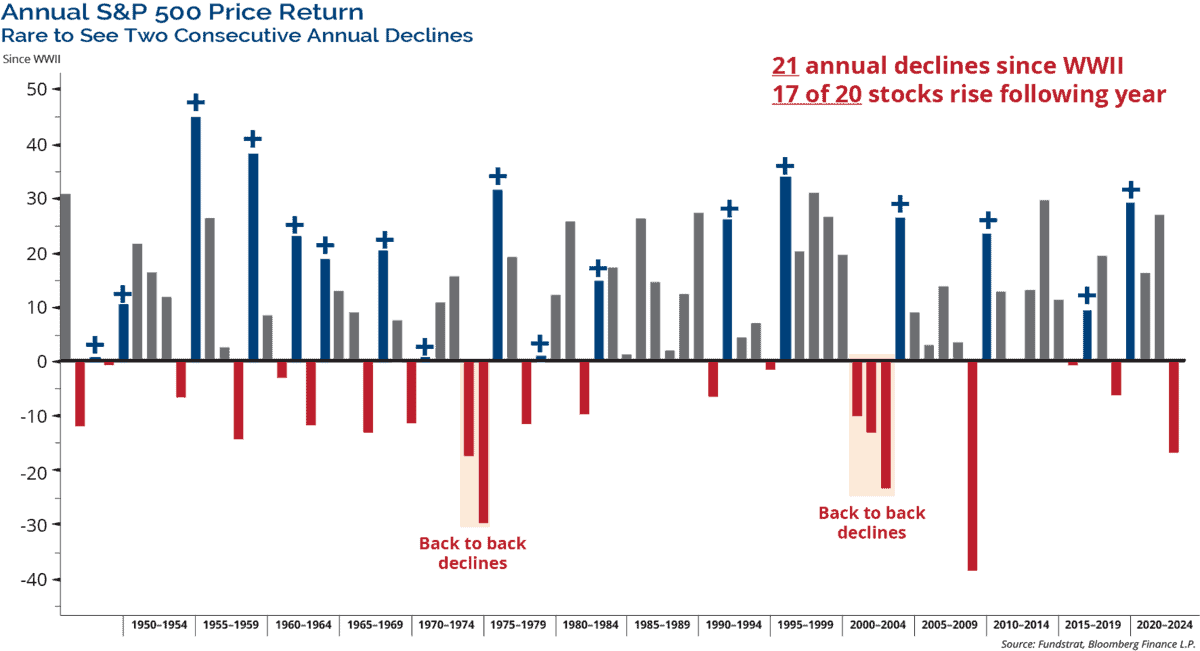
It is rare for the S&P 500 to post back-to-back negative years of return. In fact, since WWII there have only been 21 instances of annual losses, including last year. In 17 of those 20 prior cases, the index rose the following year. Our year-end target for the S&P 500 is 4200, which would be a 9.5% price gain. High yield bond losses in 2022 also suggest a positive roadmap for stocks and high yield bonds in 2023.
We believe that inflation will continue moderating and that CPI year over year should fall to 3% with the potential for a downside surprise. Base effects, slowing housing data, and commodity price round trips support the moderation of inflation. With this backdrop, we believe the Federal Reserve is in the late innings of rate hikes and we expect the final rate hikes to occur in Q1, then pause.
As always, there are risks to the outlook for the year ahead. The major risks we see include a Fed policy error by overtightening into decelerating inflation, the growing potential of a recession, negative earnings growth, geopolitical issues including the ongoing war in Ukraine, China/Taiwan tensions, and China’s COVID policy. Any of these risks could impact investor sentiment and market conditions.
“Goldilocks” Economic Conditions
Coming into last year we did not expect a recession. The economy did contract in the first half but rebounded very strongly to finish the year. While we are all debating whether a soft or hard landing is coming in 2023, the economy finished last year on a high note. As shown in the chart below in Figure 2, real GDP growth was 3.2% during the third quarter and according to the Atlanta Fed’s GDPNow model, and the economy is tracking toward 3.8% growth in the fourth quarter.
Figure 2. | Finishing the Year on a High Note
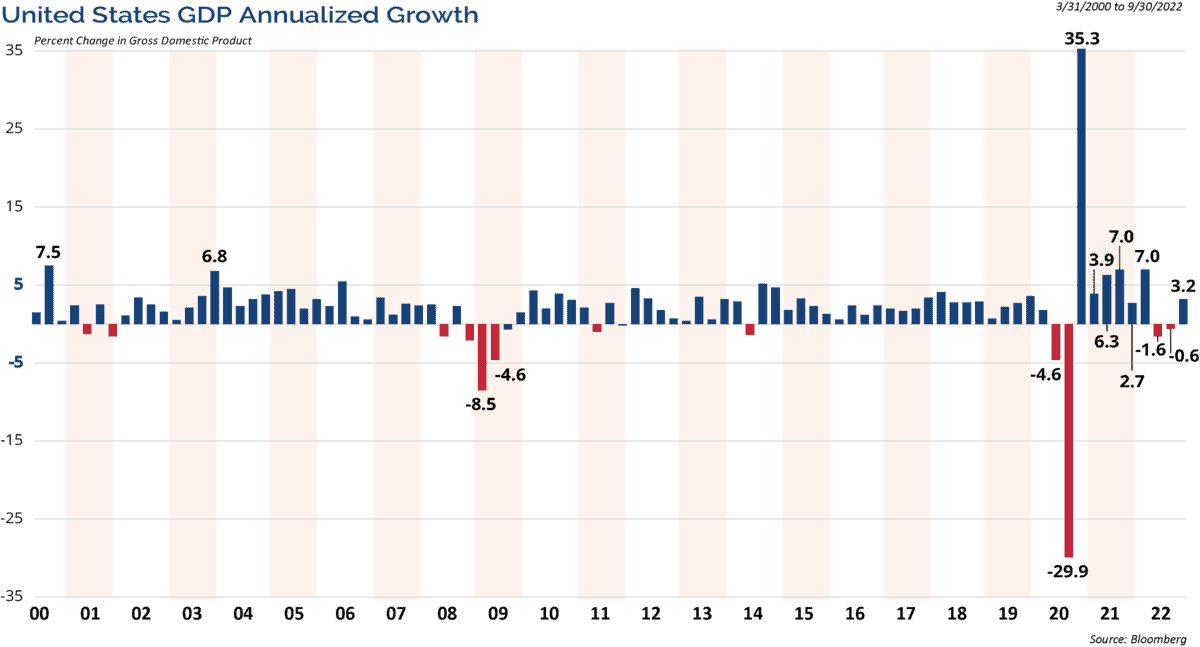
Many think that a recession is defined as two consecutive quarters of GDP decline. However, the National Bureau of Economic Research (NBER) is the organization that in hindsight, marks the beginning and end of recessions. According to the NBER, “A recession is a significant decline in activity spread across the economy, lasting more than a few months, visible in industrial production, employment, real income, and wholesale-retail trade.”
We have not yet seen a significant decline in activity. There can’t be a recession without labor market weakness, and it is possible that the Fed can engineer a soft landing. The strongest case for a soft landing is a strong labor market, and inflation and wage pressures that have peaked. In our opinion, the labor market and inflation trends are the key issues for the health of the economy.
Recent economic news has been “Goldilocks” like. For example, the December Employment Report showed that the U.S. economy created 223,000 new jobs in December, a strong number, but it was also the slowest pace of job growth since late 2020, which indicates that hiring may be cooling.
The unemployment rate fell and matched its cycle low of 3.5%, also the lowest since 1969. Total employment across America hit a new all-time high of over 153 million people. In addition, and most importantly, wage growth is slowing from its torrid pace. Average hourly earnings, which have been a contributor to inflation, slowed more than expected. A slowdown in wage growth should be welcome news to the Fed. Until meaningful weakness is revealed in the labor market, we believe that calls for recession seem a bit premature.
Inflation Seems to Be Cooling
With the high inflation we have experienced over the past 24 months, monetarists are having their day in the sun. According to Milton Friedman, “Inflation is always and everywhere a monetary phenomenon, in the sense that it is and can be produced only by a more rapid increase in the quantity of money than in output.” That is a pretty good definition of what has happened since the pandemic.
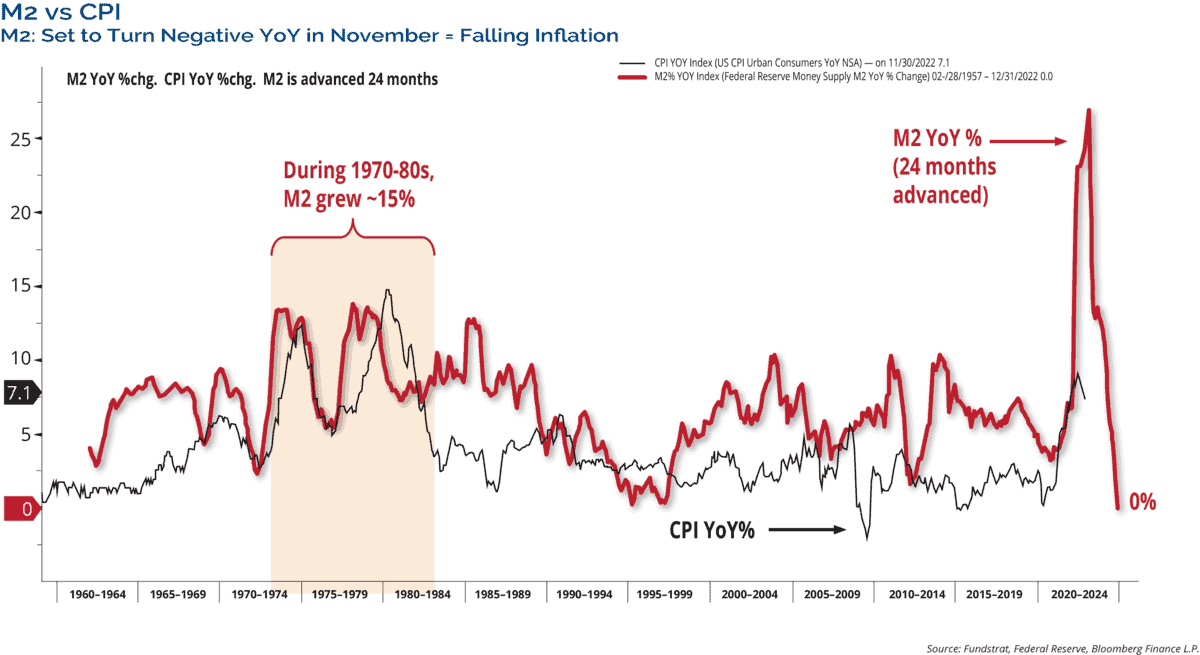
There is a very tight correlation between money supply growth and inflation. As shown in the chart below in Figure 3, money supply surged during the pandemic and peaked at a 27% year-over-year growth rate in February 2021. It has since declined sharply to 0% growth over the past year. The lack of money supply growth now should act like an anchor in pulling the inflation rate lower.
Figure 3. | Money Supply and Inflation are Tightly Linked
In our 2022 Market Outlook we said, “We do not expect runaway inflation like we saw in the 1970s and early 1980s. We expect the current high inflation to be cyclical rather than structural, and the restoration of supply chains, as more economies open up, will ease pricing pressures. Structurally, the massive debt overhang and deteriorating demographics suggest lower inflation down the road.”
Inflation peaked in June and is heading lower. Encouraging signs can be seen including peaks in gasoline, oil, wheat, and other commodity prices; they all made a round trip in 2022. Wage pressures are easing with a peak in average hourly earnings in March 2022, with the latest reading at 4.6% year over year— a sign that the labor market has begun to cool without a huge hit to payrolls.
In addition, housing has slowed with mortgage rates topping 7% last year. The shelter cost component of CPI moves with a lagged effect to the housing market. That will continue to filter through to headline inflation in the coming months. These trends should give the Fed some comfort on the inflation front and allow them to further downshift the pace of hikes as they feel their way to being “sufficiently restrictive.”
Caution Signs Ahead
Economic indicators including Leading Indicators, inverted yield curves, manufacturing indices, housing weakness, and the cumulative effect of monetary tightening suggest the odds of at least a mild recession are increasing. Let’s take a look.
The Fed has hiked rates 425 basis points so far in this cycle that began only 10 months ago. Monetary policy works with long and variable lags, so the economy is likely just now feeling the initial effects of the rate hikes.
Leading Indicators point to a slowing economy. As shown in the chart below in Figure 4, the Conference Board’s Index of Leading Economic Indicators (LEI) dropped 1.0% in November, which is the biggest decline since April 2020. It was also its ninth consecutive decline. Such prolonged declines in the LEI have historically been associated with the economy already being in recession. While this is not yet the case in the present situation, the Conference Board said, “a U.S. recession is likely to start around the beginning of 2023 and last through mid-year.”
Figure 4. | LEI Points to a Slowdown

The peak in Leading Indicators is important because over the past 60 years, early weakness in LEI has preceded every recession in the U.S. The typical lead time between the peak in LEI and the start of recessions has ranged between 4 and 21 months. Since 1960, the average lead time has been 11 months. The most recent peak in the LEI was February 2022, 10 months ago.
Inverted yield curves have been one of the most accurate predictors of a recession. Our preferred measure of the yield curve is the difference between the yield of the 10-Year Treasury Note and 3-Month T-bills, which has inverted before every recession over the past 50 years. There have been false signals, such as in the mid-1960s and in 1998, when it briefly inverted, and no recession materialized.
Just last May, this yield curve hit its steepest level since 2015. However, it quickly reversed and in October, it joined most other yield curves and inverted. On average, recessions happen about 12-18 months after the curve inverts.
Professor Harvey Campbell of Duke University, who pioneered using the yield curve as a recession indicator, thinks the yield curve signal may be less predictive this time. He recently said that “we could dodge the bullet. Avoiding the hard landing; and realizing slow growth or minor negative growth. If a recession arrives, it will be mild.”
Additional caution signs for the economy come from the manufacturing and service sectors. Surveys show they are now both in the contraction territory for the first time since the COVID meltdown. The ISM Manufacturing Index shows that the manufacturing sector has been deteriorating since late 2021. ISM’s latest reading of 48.4 puts the sector in contraction territory for the last two months.
In addition, the ISM Service Index dropped to 49.6 in December. The service sector unexpectedly shrank at the end of the year, with steep declines in measures of business activity and orders. The sector may have been impacted by the severe weather that threw holiday travel into chaos and caused widespread power outages. Additional data points will be important to monitor.
As far as policy goes, these reports should grab the attention of the Fed. Every initial Fed rate cut or pause in hikes going back to 1974 occurred as the ISM Manufacturing Index approached 50 or below. The only exception to an actual rate cut was in 2015, when the Fed paused.
Stocks Lead the Economy
Stocks are the older sibling of the economy – they do everything first. The chart in Figure 5 below shows the 12 post-WWII recessions. On average, stocks start going down about 5.5 months BEFORE the recession starts with a median decline of just shy of 23%. They start going up 3.5 months BEFORE the recession is over. Keep in mind the S&P 500 was down about 25% from 1/3/22 to 10/12/22, which is more than the decline in an average recession.
Figure 5. | Bear Markets Lead Recessions
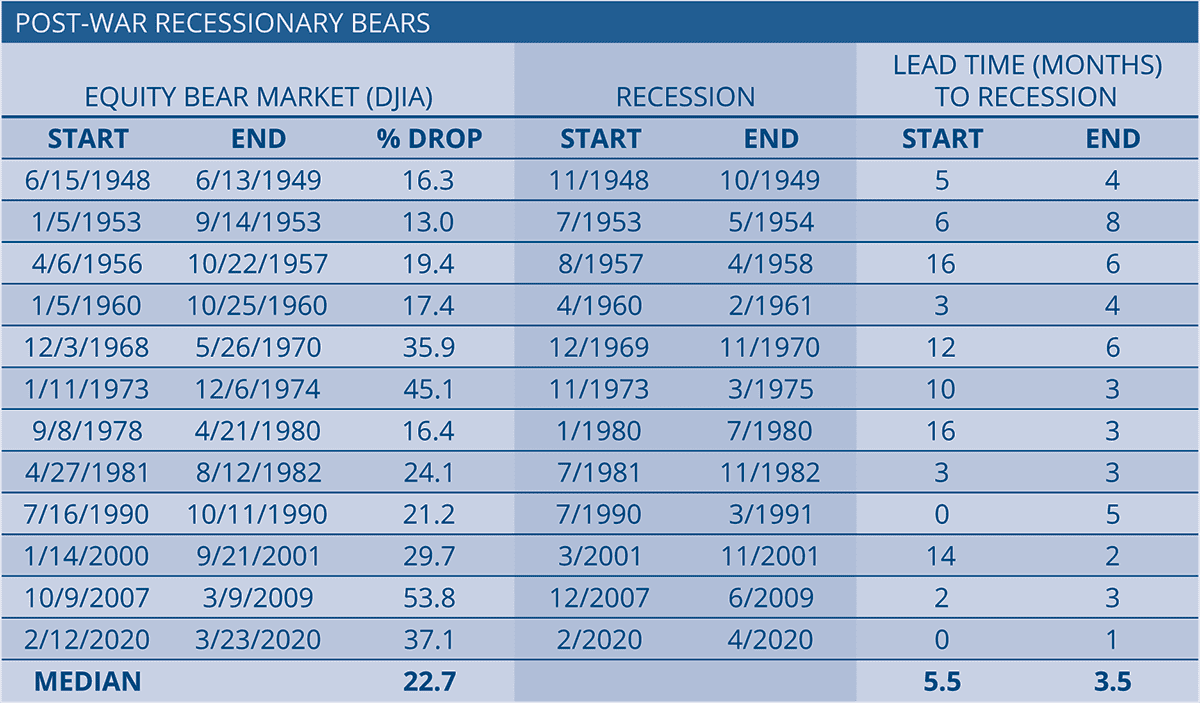
So this begs the question… has the market already discounted a substantial amount of any economic weakness to come this year? In our opinion, yes. If there is no recession, and the Fed does orchestrate a soft landing, then stocks should be off to the races. If we do have a mild recession, as the data above suggests, then the bear market of 2022 and the lows hit in October likely contain any weakness. In a deep recession scenario, which is not our expectation, then the market would make new lows to discount more economic weakness.
Cyclical Factors Suggest a Bounceback
There are bullish factors in place as we start the New Year. The Ned Davis Research Cycle Composite combines the one-year cycle, four-year cycle (election years), and decennial cycle into a single composite. The Cycle Composite has a good historical track record. Although we note no single indicator or past cycles can necessarily predict the future, we use it as a guide to see how the market may trade directionally in the upcoming year. For 2023, this composite suggests a strong year, with gains front loaded in the first half of the year. This also paints a bullish picture for the soft-landing case.
We are also in the third year of the President’s term, or pre-election year. In the post-WWII era, the third year has been the strongest of the four-year cycle. The median gain for the S&P 500 in the third year of the presidential cycle is 16.8%. Historically, the strong gains have been due to the mid-term seasonal gains that normally extend into the next year, and the fact that no recession has started in the first half of a pre-election year. We will wait and see if history repeats itself.
Pessimism May Be Fuel for the Markets
Extremes in investor sentiment are normally contrarian indicators, with optimistic sentiment leading to corrections or pullbacks, and pessimistic extremes leading to rebounds.
By many measures, including the American Association of Individual Investors (AAII) Sentiment Poll and record put/call ratios, investors have never been more bearish towards the stock market than they are right now. Last year, investor sentiment remained bearish almost all year. The average readings of bullish sentiment in 2022 for AAII set record lows dating back to the inception of the survey in 1987. As we enter 2023, pessimistic investor sentiment may offer future bullish fuel for the markets.
2022 Was Marked by Volatility
Volatility across asset classes was extreme in 2022. For example, the S&P 500 had three 10% or greater declines, tying 2008, 2002, and 1987 for the most since the 1930s. Volatility in the bond market was also extreme, and by several measures it was at or near the most volatile on record.
Figure 6. | Total Trading Days Greater than +/-1%
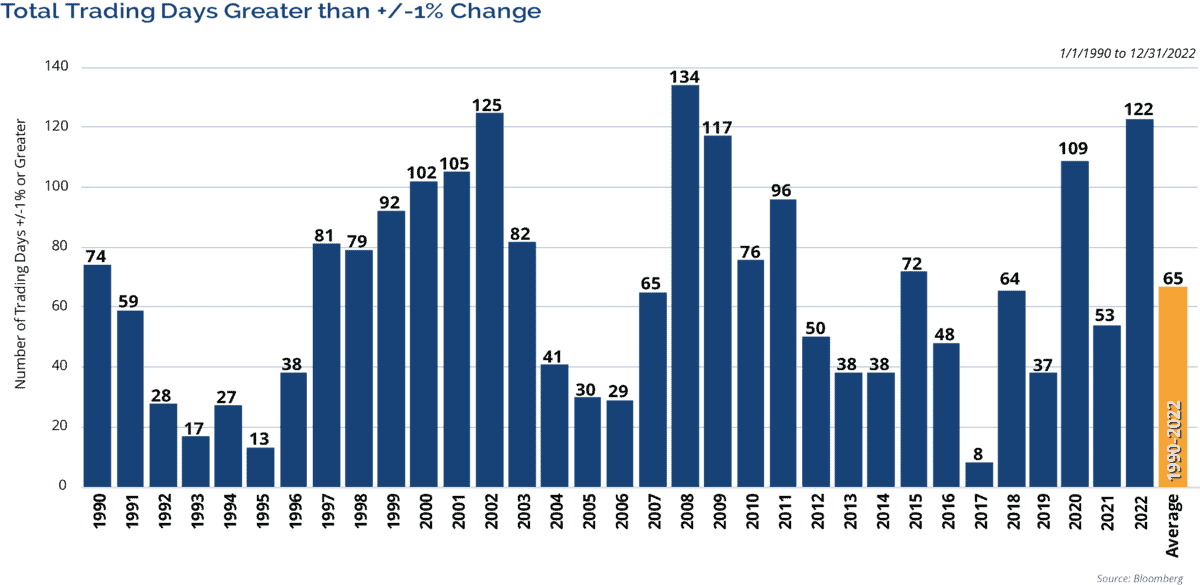
As shown in Figure 6 above, the stock market also had an extreme number of days with greater than a 1% move, that occurred in 122 days last year. Going back to 1953, when the current five-day trading week began, only two other years have seen more 1%+ moves in either direction: 2002 (125) and 2008 (134). Not particularly good years!
In addition, the CBOE Volatility Index (VIX) remained elevated throughout the year. The average VIX level for the year was just over 25. There were only six years where the VIX average was higher: 1998, 2001, 2002, 2008, 2009, and 2020. Volatility usually drops the following year after being at elevated levels and in those prior cases, and the S&P 500 posted gains in 5 of 6 years, with an average gain of 14.3%.
Back-to-Back Annual Declines Are Rare
Historical trends also suggest that next year should be positive for stocks as back-to-back annual declines are rare. As shown in Figure 7 below, since WWII, there have been only 21 instances including last year, of annual losses. The average return following a down year for the S&P 500 is 14.3%, and the index rose in 17 of the prior 20 cases.
Figure 7. | Rare to See Two Consecutive Annual Declines
Favorable credit cycles help propel economic growth and negative credit cycles have a restraining impact on the economy. As a result, credit and equities have a positive correlation with one another. In most years, high yield bond and stock returns are closely linked. What is notable is that since the inception of the asset class, high yield bonds have only declined in eight calendar years, including last year.
In the prior seven cases after years of high yield bond declines, the S&P 500 has been up an average of 22%, with only one negative year. High yield bonds have been up an average of 25% the year after suffering a loss, with no back-to-back annual years of decline. Just to be clear, we don’t expect those kinds of returns this year, but the correlations and trends are worth paying attention to.
A Wide Range of Outcomes for Earnings
S&P 500 trailing and forward P/E ratios compressed for a second year in a row and are very close to their long-term averages. P/Es fell for different reasons. In 2021, the fastest earnings growth in over a decade meant that even a 26.9% gain in the S&P 500 could not prevent multiple compression. In 2022, the pain was mostly felt on the earnings side. The reason the forward P/E fell so much more than trailing metrics is that analysts are expecting a 13.6% rebound in operating earnings in 2023. Earnings estimates could be the biggest risk for the stock market next year.
Two-year stretches of multiple compression are rare, but not unheard of. What makes 2021 and 2022 unique is the magnitude. The two-year change in the forward and trailing P/Es are the biggest on record. Will P/Es fall for a third year in a row? Again, it’s rare, but not unprecedented. The forward P/E fell in 1992-1994. The trailing P/E did it twice, from 1992-1994 and 2004-2006. What the early 1990s and mid-2000s both had in common was that the Fed tightened, but the economy had not fallen into a recession.
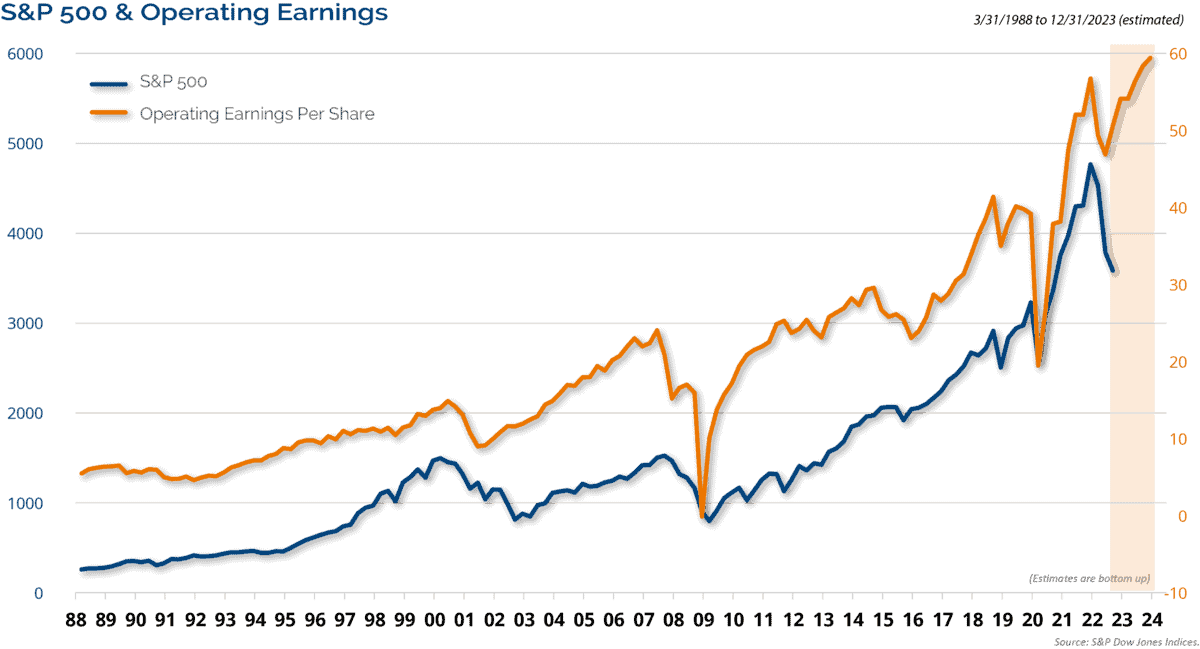
The stock market leads the economy and earnings trail. However, the chart below in Figure 8 shows that over time, stock prices and earnings growth are very correlated. Higher earnings have led to higher stocks and times of earnings decline, such as the recessions of the early 2000s, 2008, and 2020; stocks have followed suit.
Figure 8. | Higher Earnings Lead to Higher Stock Prices
Full calendar year 2022 earnings are expected to have declined by 3.5%. That is in stark contrast to the 9% earnings growth that analysts expected coming into last year. Inflation, labor costs, and margin pressures were the primary causes of the decline in earnings. For 2023, analysts currently expect earnings to grow by 13.6%. That seems unrealistic given the headwinds facing the economy. In fact, actual earnings tend to be about 8 percentage points below estimates at the beginning of the year.
We expect to see estimates revised lower to adjust to the current economic reality. We expect 5% earnings growth for the year; however, there is downside risk in a recession scenario. Anything greater than a mild recession could see earnings decline 10-15%. So again, there is a wide range of outcomes depending upon the direction of the economy.
Figure 9. | Earnings Down, Stocks Up: Not a Rarity
 The chart in Figure 9 above plots the year-over-year (YoY) earnings growth and annual returns for the S&P 500 dating back to the mid-1960s. It shows that it is not uncommon for stocks to gain in years when corporate earnings decline, which is represented by the dots in top left quadrant of this chart. There are many years where the market posts double-digit gains with zero or negative earnings growth.
This is because the market leads, and the S&P 500 has historically bottomed an average of almost 12 months before earnings bottom. Since the 1920s, 13 of 16 major market lows saw the S&P 500 bottom before earnings. Therefore, we think we may see P/E multiples expand a little following two years of compression.
International Trends Changing
Since the end of the Global Financial Crisis, U.S. stocks have dramatically outperformed international equities. From the end of 2008 through 2022, the S&P 500 gained 462% (13.12% per annum) and the MSCI All Country World Index ex-US gained 130% (6.13% per annum). Over that stretch, the U.S. outperformed international stocks in 10 of 14 years, and not once did foreign stocks outperform for two consecutive years. Could that be about to change? International stocks slightly outperformed the U.S. last year. That is surprising to many given the challenges overseas in Europe from the war in Ukraine, gas and wheat supply shortages, and the COVID restrictions that China had in place.
International stocks have recently benefited from U.S. dollar weakness. The dollar peaked on 9/27 and fell 9.3% into year end. Over that same time, international stocks outperformed by 838 basis points. Valuations are another factor favoring international stocks. Forward P/E multiples are almost one-third lower for international stocks.
In some of our tactical strategies, we increased the allocation to international stocks throughout the second half of last year. We have not increased our strategic allocation to international stocks yet, but these trends are something that we are watching very closely.
Value vs. Growth
The Energy, Materials, and Industrial sectors’ outperformance last year were growth stocks’ loss. Higher interest rates, reshoring of manufacturing, and demand for goods and services reversed the macro conditions that had favored growth and large-cap technology for years.
The value-tilted Dow Jones Industrial Average outperformed the growth-oriented NASDAQ by 24.6 percentage points last year, the widest margin since the dotcom bubble burst in 2000. Given the rise in interest rates and likely higher for longer Fed stance, we look for the recent value outperformance trend to continue, but just not to same large extreme.
Any End In Sight?
We expect the Fed to end its tightening cycle in the first quarter. Following four consecutive 75 basis point hikes, the Fed downshifted its rate hike to 50 basis points in December. The Fed’s next two meetings occur on February 2nd and March 16th. Recent Fed speak suggests the Fed will hike overnight rates to 5% – 5.25%, where we suspect they will consider policy to be “sufficiently restrictive.” The Fed has historically waited a median of about 8 months from their last rate hike to the first rate cut, which means history suggests the earliest we should expect a rate cut is in the fourth quarter. Bonds could easily rally before the Fed cuts, they already have done so on signs of economic slowing, which could take the 10-Year Treasury Note yield down towards 3%.
Given that the Fed is nearing the last rate hike for this cycle, we thought it would be helpful to look at how the market performs during rate hike cycles and leading up to the last hike. As shown in the chart below in Figure 10, the market has declined more in this cycle than the prior four. If the October low holds, then the market declined 18% from the Fed’s first rate hike, compared to an average decline of 7% in the prior four tightening cycles. That is understandable this time given the high inflation and more aggressive tightening. What we want to highlight is that the market rallies well before the Fed is done hiking rates, with an average almost 20% gain for the S&P 500 from its low to the last hike. So far this cycle, from the October low, the S&P 500 has gained 7.75% into year-end.
Figure 10. | Market Rallies Before Rate Hikes End
| Fed Rate Hike Cycles | # | Total Increase(bps) | Max Decline | Days Until Bottom | % Change From Low to Last Hike | Days Before Last Hike | Length of Cycle |
|---|---|---|---|---|---|---|---|
| 2/4/1994-2/1/1995 | 7 | 300 | -9% | 59 | +7.2% | 303 | 362 |
| 6/30/1999-5/16/2000 | 6 | 15 | -4% | 107 | +17.5% | 214 | 321 |
| 6/30/2004-6/29/2006 | 17 | 425 | -5% | 43 | +19.7% | 686 | 792 |
| 12/16/2015-12/29/2018 | 9 | 225 | -12% | 56 | +34.9% | 1043 | 1099 |
| 3/16/2022-???? (IN PROGRESS) | 7 | 425 | -17% | 210 | ???? | ???? | ???? |
| AVERAGE | 9.75 | 281.25 | -7% | 66 | +19.8% | 562 | 628 |
Credit Fundamentals Remain Solid
It was a tough year for bonds across the board as rate volatility drove losses across the asset class. There has not been much credit deterioration as rates have risen. The high yield credit spread ended the year right around its long-term average. Financial conditions have eased recently even as the Fed hikes rates, evidenced by the fact that high yield spreads peaked in July, BBB spreads peaked in October, the S&P 500 bottomed in October, the U.S. dollar peaked in September, and the 10-year Treasury Note yield fell 82 basis points from its high into year end.
We believe fixed income now looks more attractive with the backup in yields. Investment grade corporate debt is yielding over 5% and the Bloomberg Barclays High Yield Corporate Bond Index closed the year with an 8.96% yield (as shown in Figure 11 on the next page). That is a lot of yield to collect with no real credit stress evident in the sector. In addition, we discussed earlier that high yield bonds have never had back-to-back annual years of decline.
Figure 11. | Fixed Income Looks More Attractive with the Backup in Yields

In the corporate bond market, overall credit fundamentals remain in good shape. The benign default environment since the post-pandemic recovery began is largely attributable to the strength of balance sheet fundamentals, with strong liquidity positions, low net leverage, and record high interest coverage ratios. The headline 12-month trailing default rate has remained below 2% in the U.S., which is well below the long-term average of 4.5%. While high yield default rates could pick up this year, they should remain in benign territory due to strengthening balance sheets with a full year 2023 default rate forecast of just 2.8%. Even if the U.S. economy enters a recession, we still expect the peak in high yield default rates to be lower than in previous cycles.
Conclusion
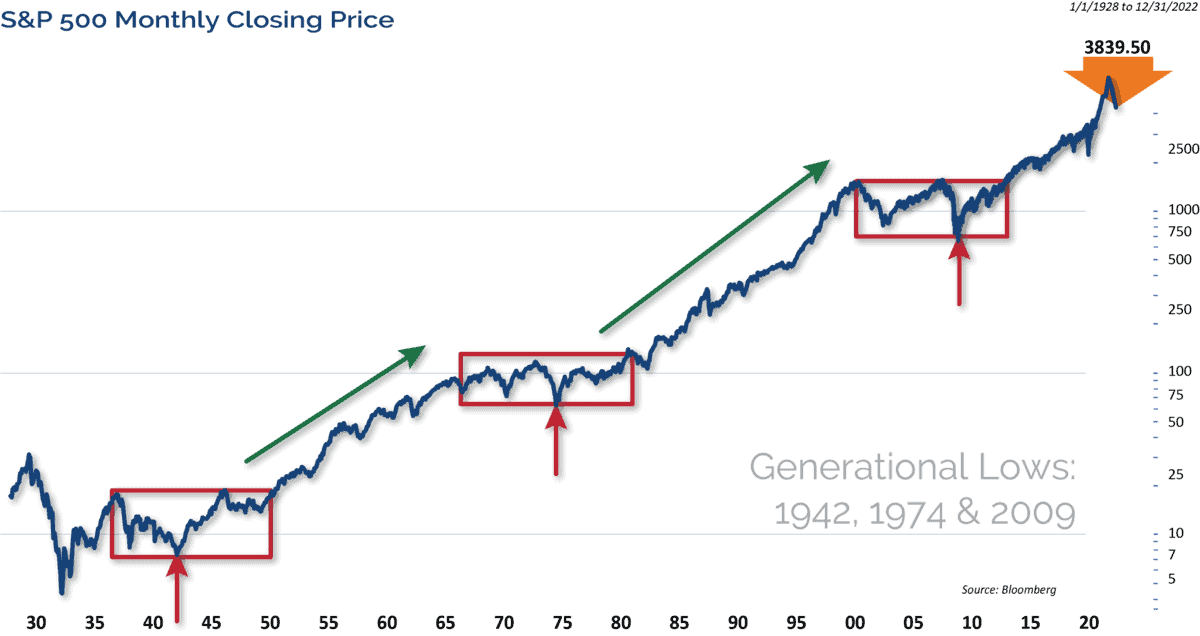
Since the Global Financial Crisis ended, the stock market has been in a secular bull market as shown in Figure 12 below. We believe the long-term bull market is still intact, even after the losses suffered in 2022.
Figure 12. | Secular Bull Market Remains Intact
As we enter 2023, consensus expectations are calling for a recession and more pain for the markets. While a lot of the macro headwinds still exist today, we believe those headwinds could turn into tailwinds as the year progresses. Therefore, we have a bit more of an optimistic view of the potential for the markets in 2023. The economy enters the year with quite a bit of momentum, and we are finally seeing wage pressures ease. Inflation peaked mid last year and should continue to trend lower. We look for the economy to marginally expand by 0.5% in 2023, with about even odds of a mild recession.
We saw that stocks have rarely declined in back-to-back years, and they normally bottom well before earnings. Our year-end target for the S&P 500 is 4200. The Federal Reserve is likely to pause its rate hike cycle once overnight rates reach 5.0%-5.25%.
As always, there are risks to the outlook for the year ahead. The major risks we see include a Fed policy error by overtightening into decelerating inflation, growing potential of a recession, possibility of negative earnings growth, and geopolitical issues. We believe that clients should be focused on their long-term goals and objectives, and should not be derailed by short-term swings in the markets.
Eager for More Insights? Visit our 2023 Market Outlook Resource Center.
The opinions expressed are those of Clark Capital Management Group. The opinions referenced are as of the date of publication and are subject to change due to changes in the market or economic conditions and may not necessarily come to pass. There is no guarantee of the future performance of any Clark Capital investment portfolio. Material presented has been derived from sources considered to be reliable, but the accuracy and completeness cannot be guaranteed. Nothing herein should be construed as a solicitation, recommendation or an offer to buy, sell or hold any securities, other investments or to adopt any investment strategy or strategies. For educational use only. This information is not intended to serve as investment advice. This material is not intended to be relied upon as a forecast or research. The investment or strategy discussed may not be suitable for all investors. Investors must make their own decisions based on their specific investment objectives and financial circumstances. Past performance does not guarantee future results.
This document may contain certain information that constitutes forward-looking statements which can be identified by the use of forward-looking terminology such as “may,” “expect,” “will,” “hope,” “forecast,” “intend,” “target,” “believe,” and/or comparable terminology (or the negative thereof). No assurance, representation, or warranty is made by any person that any of Clark Capital’s assumptions, expectations, objectives, and/or goals will be achieved. Nothing contained in this document may be relied upon as a guarantee, promise, assurance, or representation as to the future.
Clark Capital Management Group, Inc. is an investment adviser registered with the U.S. Securities and Exchange. Commission Registration does not imply a certain level of skill or training. More information about Clark Capital’s advisory services can be found in its Form ADV which is available upon request.
The Barclays U.S. Corporate High-Yield Index covers the USD-denominated, non-investment grade, fixed-rate, taxable corporate bond market. Securities are classified as high-yield if the middle rating of Moody’s, Fitch, and S&P is Ba1/BB+/BB+ or below.
Index returns include the reinvestment of income and dividends. The returns for these unmanaged indexes do not include any transaction costs, management fees or other costs. It is not possible to make an investment directly in any index.
Fixed income securities are subject to certain risks including, but not limited to: interest rate (changes in interest rates may cause a decline in market value or an investment), credit, prepayment, call (some bonds allow the issuer to call a bond for redemption before it matures), and extension (principal repayments may not occur as quickly as anticipated, causing the expected maturity of a security to increase).
Non-investment-grade debt securities (high-yield/junk bonds) may be subject to greater market fluctuations, risk of default or loss of income and principal than higher-rated securities
The S&P 500 measures the performance of the 500 leading companies in leading industries of the U.S. economy, capturing 75% of U.S. equities.
The Russell 1000 Value Index measures the performance of the large-cap value segment of the U.S. equity universe. It includes those Russell 1000 companies with lower price-to-book ratios and lower expected growth values.
The Russell 1000 Growth Index measures the performance of the large-cap growth segment of the U.S. equity universe. It includes those Russell 1000 Index companies with higher price-to-book ratios and higher forecasted growth values.
The Russell 1000 Index measures the performance of the large-cap segment of the U.S. equity universe. It is a subset of the Russell 3000® Index and includes approximately 1000 of the largest securities based on a combination of their market cap and current index membership. The Russell 1000 represents approximately 92% of the U.S. market.
The Russell 2000 Index measures the performance of the 2000 smallest U.S. companies based on total market capitalization in the Russell 3000, which represents approximately 10% of Russell 3000 total market capitalization.
The Russell 3000 Index measures the performance of the 3000 largest U.S. companies based on total market capitalization, which represents approximately 98% of the investable U.S. equity market.
The MSCI Emerging Markets Index is a free float-adjusted market capitalization index that is designed to measure equity market performance of emerging markets. The MSCI Emerging Markets Index consists of the following 21 emerging market country indices: Brazil, Chile, China, Colombia, Czech Republic, Egypt, Hungary, India, Indonesia, Korea, Malaysia, Mexico, Morocco, Peru, Philippines, Poland, Russia, South Africa, Taiwan, Thailand, and Turkey.
The MSCI World ex US Index is a market capitalization-weighted index designed to measure equity performance in 22 global developed markets, excluding the United States. The benchmark for this composite is used because the MSCI World Ex US Net Index is generally representative of international equities.
BBgBarc U.S. Aggregate Bond Index covers the U.S. investment-grade fixed-rate bond market, including government and credit securities, agency mortgage pass-through securities, asset-backed securities and commercial mortgage-based securities. To qualify for inclusion, a bond or security must have at least one year to final maturity, and be rated investment grade Baa3 or better, dollar denominated, non-convertible, fixed rate and publicly issued.
The BBgBarc US Treasury Index measures US dollar-denominated, fixed-rate, nominal debt issued by the US Treasury. Treasury bills are excluded by the maturity constraint but are part of a separate Short Treasury Index. STRIPS are excluded from the index because their inclusion would result in double-counting. The US Treasury Index is a component of the US Aggregate, US Universal, Global Aggregate and Global Treasury Indices.
The BBgBarc US Corporate Bond Index measures the investment grade, fixed-rate, taxable corporate bond market. It includes USD-denominated securities publicly issued by US and non-US industrial, utility and financial issuers. The US Corporate Index is a component of the US Credit and US Aggregate Indices, and provided the necessary inclusion rules are met, US Corporate Index securities also contribute to the multi-currency Global Aggregate Index.
The BBgBarc U.S. Corporate High-Yield Index covers the U.S. dollar-denominated, non-investment grade, fixed-rate, taxable corporate bond market. Securities are classified as high-yield if the middle rating of Moody’s, Fitch, and S&P is Ba1/BB+/BB+ or below.
The BBgBarc U.S. Municipal Index covers the USD-denominated long-term tax-exempt bond market. The index has four main sectors: state and local general obligation bonds, revenue bonds, insured bonds and prerefunded bonds.
The Global Manufacturing PMI™ indices are all seasonally adjusted. The seasonal adjustment is applied at the national level (as opposed to at the global aggregate level) in order to account for differing seasonal patterns in each of the nations included. Global Manufacturing PMI™ indices are weighted according to national contributions to global manufacturing gross value added. Weights for the global indices are derived from the latest available World Bank data on the gross value added of manufacturing for each of the nations covered. World Bank data on value added are in constant 2010 US$, with all national currencies converted to 2010 US$ by the World Bank using DEC alternative conversion factors.
The NDR Credit Conditions Indices (CCI) are designed to objectively measure credit conditions in the U.S. market, specifically the cost & availability of credit. The index consists of two equal-weighted components and historically evaluates business and consumer credit conditions.
NDR (Ned Daily Research) Daily Trading Sentiment Index is based on the S&P 500 Daily Sentiment Index which shows a short-term sentiment view of the S&P 500 Index
Created by the Chicago Board Options Exchange (CBOE), the Volatility Index, or VIX, is a real-time market index that represents the market’s expectation of 30-day forward-looking volatility. Derived from the price inputs of the S&P 500 index options, it provides a measure of market risk and investors’ sentiments.
The 10-year Treasury note is a debt obligation issued by the United States government with a maturity of 10 years upon initial issuance. A 10-year Treasury note pays interest at a fixed rate once every six months and pays the face value to the holder at maturity.
The Dow Jones Industrial Average is the most widely used indicator of the overall condition of the stock market, a price-weighted average of 30 actively traded blue chip stocks, primarily industrials. The 30 stocks are chosen by the editors of the Wall Street Journal (which is published by Dow Jones & Company), a practice that dates back to the beginning of the century. The Dow is computed using a price-weighted indexing system, rather than the more common market cap-weighted indexing system.
Index returns include the reinvestment of income and dividends. The returns for these unmanaged indexes do not include any transaction costs, management fees or other costs. It is not possible to make an investment directly in any index.
The volatility (beta) of an account may be greater or less than its respective benchmark.
The Consumer Price Index (CPI) measures the change in prices paid by consumers for goods and services. The CPI reflects spending patterns for each of two population groups: all urban consumers and urban wage earners and clerical workers. CCM-672
![]()
