Navigating Market Uncertainties
Highlights
We believe:
- Economic momentum has carried through the first half of the year.
- Several economic indicators urge caution, but the economy continues to defy naysayers. Growth could moderate in the second half.
- We see further upside for the markets, and we are increasing our year-end S&P 500 target to 4500.
- There is early evidence of the market starting to broaden out after record concentration.
- Earnings revisions have been higher for seven straight months.
- Inflation is set to continue moderating. The latest Producer Price Index (PPI) and Consumer Price Index (CPI) readings are 1.4% and 4.0%, respectively, year over year.
- The Federal Reserve is in the late innings of rate hikes after a pause in June. The market is pricing in one more rate hike.
Markets Remain Resilient
It’s been an interesting first half of the year. Markets performed very well in the face of continued Fed tightening, calls for an imminent recession, a regional banking crisis, debt ceiling debate, and drama around an 11th hour deal to avoid a default on U.S. debt.
Through it all, the economy and markets have surprised to the upside. In stark contrast to last year, stocks and bonds are both posting gains. Since the bear market lows on October 12th, the S&P 500 is up 25.2% on a total return basis. Stock performance has been concentrated in mega-cap growth companies, but we are starting to see the market’s participation broaden out. As shown in Figure 1 below, year to date through June 15th, the S&P 500 is up 16.19%, small-caps are up 8.01%, and international stocks are up 11.28%. The standout so far has been large-cap growth, which is up over 28% year to date and is outperforming large-cap value by almost 2400 basis points.
Figure 1. Perspective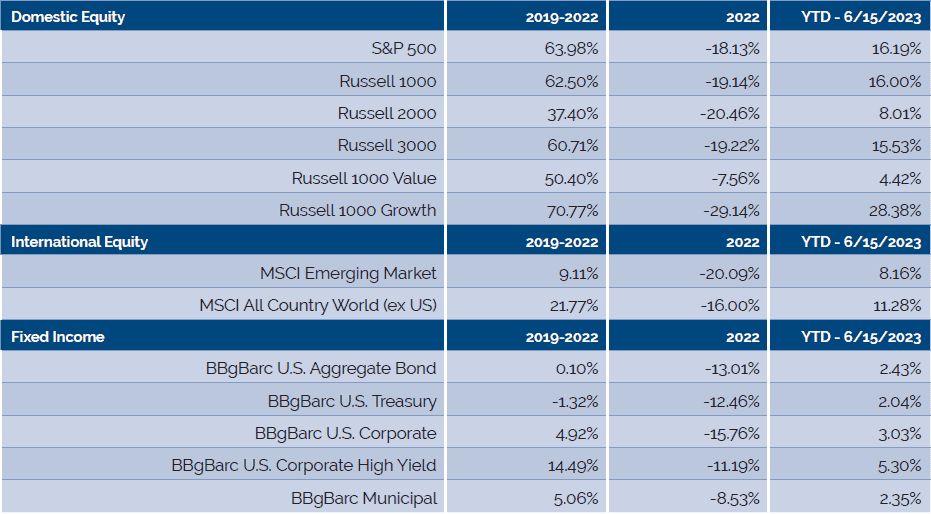
Fixed income also posted gains following the worst bond market on record. Credit outperformed duration with high yield and investment grade corporate indices up 5.3% and 3.3%, respectively, while Treasuries posted a more modest 2.0% gain.
Highlighting what we covered in our January Market Outlook, most of what we reviewed still applies. Coming into the year, consensus expectations were calling for a recession and more pain for the markets. We were certainly not in that camp, and believed that economic momentum would continue into at least the first half of 2023, with growth moderating in the second half of the year. We expected the economy to grow by only 0.5% in 2023, and placed odds of muddle through growth or a mild recession at 50/50. The economy still looks good and having gotten past the debt drama and banking crisis, the case for a soft landing is growing.
The range of potential outcomes for the equity markets was wide this year, and largely hinged on the economy. We were bullish, and still are. It’s rare for the S&P 500 to post back-to-back negative years of returns. In fact, since WWII there have been 21 instances of annual losses; in 18 of those 21 cases, the index rose the following year.
In January, our year-end target for the S&P 500 was 4200. We are happy to say that the market has already surpassed that target. We now see upside potential to reach 4500. The second half of the year could be a lot choppier with most of the gains for the major indices front loaded. We are now beginning to see evidence of market participation broadening out beyond just the mega-cap growth companies.
Inflation is set to continue moderating. Producer prices have risen only 1.4% year over year and consumer price inflation (CPI) has fallen to 4% year over year. CPI should fall to 3% with the potential for a downside surprise. With inflation set to continue falling, the Federal Reserve is in the late innings of rate hikes. The Fed paused at their June FOMC meeting and took a more data dependent view. The market is pricing in one more rate hike.
The major topics we will focus on in this outlook include where we stand on the economy, inflation, Fed policy, and the equity markets. So, let’s start with the economy.
The U.S. Economy Continues to Defy the Naysayers
When it comes to the U.S. economic outlook, there are plenty of negatives to focus on. Interest rates are much higher than a year ago, and the Fed has signaled that they’ll stay higher for longer, inventories are still in correction mode, and leading indicators and the yield curve urge caution. However, the economy continues to defy the naysayers, posting three consecutive quarters of GDP growth and the Atlanta Fed’s GDPNow model is forecasting 1.8% real GDP growth in the current quarter.
The main reason for optimism on the U.S. economy is that inflation, especially prices for commodities, is easing more rapidly than the labor market. As a result, real incomes are expanding, supporting consumption. Plenty of indicators point to a dim economic outlook in the coming quarters. But current activity is still positive as the economy continues to avert a recession.
In January’s Market Outlook we said, “Until meaningful weakness is revealed in the labor market, calls for recession seem premature.” The epicenter of the economy’s resilience has been the labor market. The Fed’s tightening cycle has been aimed at boosting the unemployment rate to slow wage and price inflation. Instead, the labor market has remained strong. Year to date, the economy has averaged 314,000 new jobs per month through May and the unemployment rate sits at 3.7% as shown in Figure 2.
Figure 2: Labor Market Remains Strong
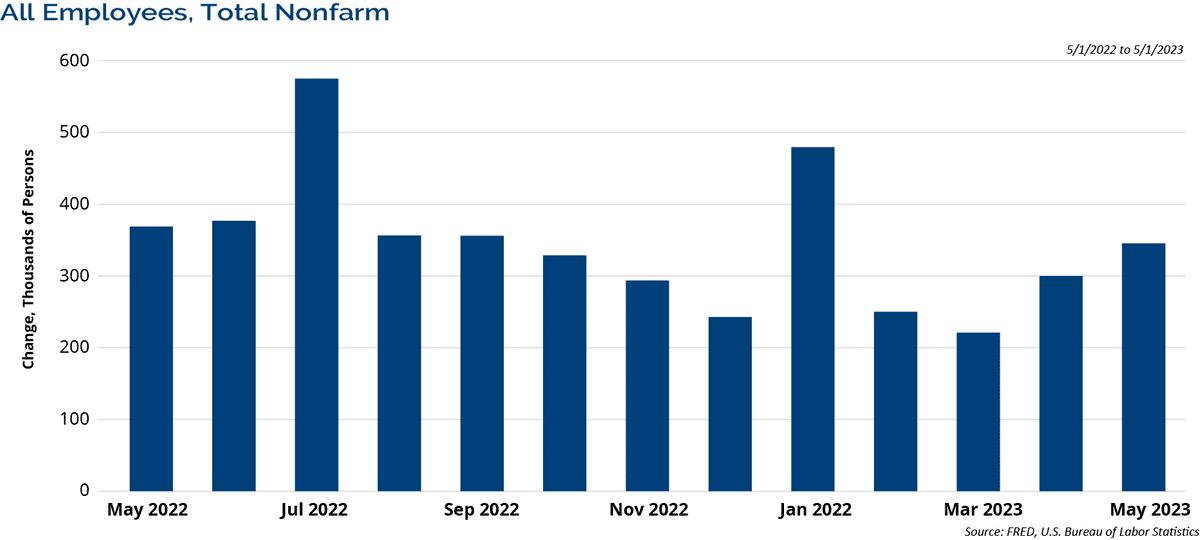
Source: FFRED, U.S. Bureau of Labor Statistics. For illustrative purposes only. Past performance is not indicative of future results.
We believe economists have been way too pessimistic on the labor front. For the past 14 months in a row, economists have underestimated the rate of job growth in the U.S. economy. That is an unprecedented streak of better-than-expected jobs growth. As long as the labor market remains strong, we believe that any chance of a recession will keep getting kicked down the road.
Tracking Recession Risks
While the economy remains resilient, there are several indicators that urge caution including the Index of Leading Economic Indicators and the inverted yield curve. The Fed has hiked rates a record 500 basis points so far this cycle that began only 15 months ago. Monetary policy does work with long and variable lags. So, the economy is likely just now feeling the effects of the rate hikes.
The Conference Board’s Index of Leading Economic Indicators (LEI) peaked in December 2021, 16 months ago, and has declined in 13 straight months. The peak in Leading Indicators is important because over the past 60 years, early weakness in LEI has preceded every recession in the U.S. The typical lead time between the peak in LEI and the start of recessions has ranged between 4 and 21 months. Since 1960, the average lead time has been 11 months.
According to the Leading Indicators, we are in the area that recessions start; however, the economy continues to chug along and defy the economic naysayers.
Inverted yield curves have been one of the most accurate predictors of a recession. Our preferred measure of the yield curve is the difference between the yield of the 10-year Treasury and 3-month T-bills, which has inverted before every recession over the past 50 years. This time, it inverted in October 2022, which is now 8 months into its inversion. It often has a substantial lead time before recessions have started.
For example, prior to the COVID recession, it inverted in March 2019, 11 months prior to the start of the recession. Prior to the Global Financial Crisis, it inverted in July 2006, 17 months prior to that recession. Note though, there have been false signals, such as in the mid-1960s and in 1998 when it briefly inverted and no recession materialized.
In our Annual Outlook we quoted Professor Harvey Campbell, who pioneered using the inverted yield curve as a recession indicator. He said the yield curve signal may be less predictive this time. Time will tell, but so far, the recession keeps moving further into the future.
Turning to the Equity Markets
It’s rare for the S&P 500 to post back-to-back negative years of return. In fact, since WWII there have been 21 instances, including last year, of annual losses. The average return following a down year for the S&P 500 is 14.3%, and the index rose in 17 of the 20 prior cases.
Another bullish factor is that in the post-WWII era, the third year of the President’s term, or pre-election year, has been the strongest of the four-year cycle. The median gain for the S&P 500 in the third year of the Presidential Cycle is 16.8%. The strong historic gains are due to the mid-term election seasonal gains that normally extend into the next year, strong fiscal stimulus heading into the election year, and the fact that no recession has started in the first half of a pre-election year.
Figure 3 shows the Ned Davis Research Cycle Composite for 2023. It combines the one-year cycle, four-year cycle (election years), and decennial cycle into a single composite. The blue line is the Composite, and the red line is the actual S&P 500.
Figure 3: Cycle Composite Suggests a Strong Year
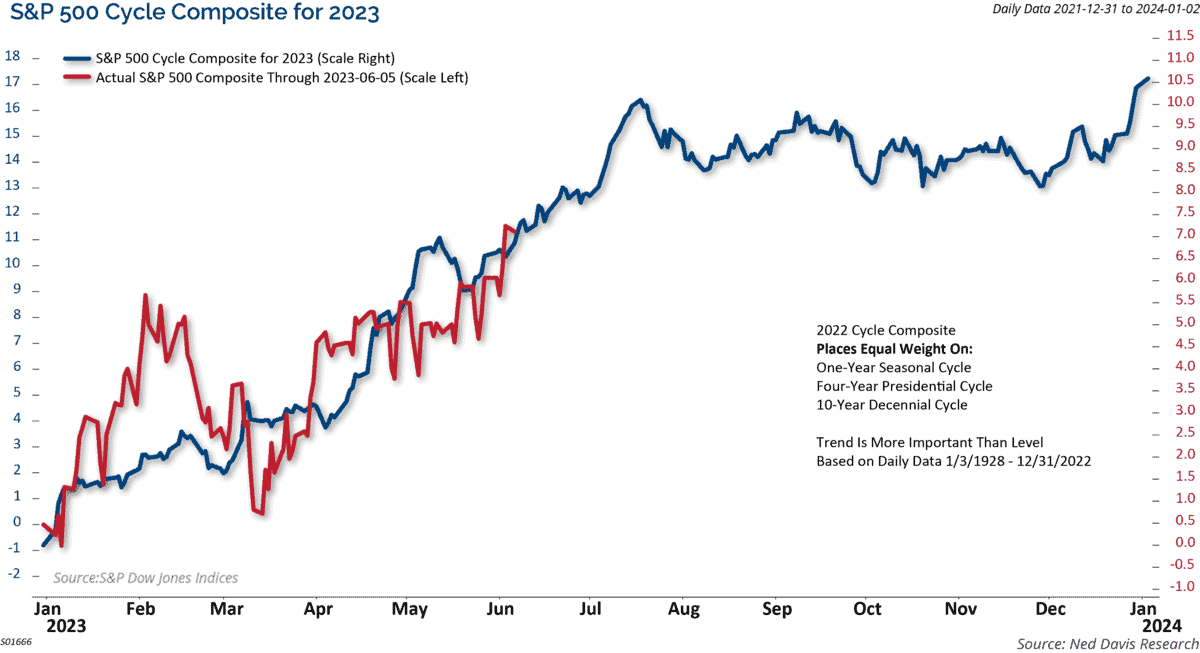
Source: Ned Davis Research. For illustrative purposes only. Past performance is not indicative of future results. Projections or other forward looking statements regarding future financial performance of markets are only predictions.
The bullish signal from the Composite was one of the many reasons we were more bullish in our January Outlook than most strategists. Coming into the year we said, “This paints a bullish picture for the soft landing case, no recession, in which the market would respond favorably.”
The Composite suggested a strong year, with gains front loaded in the first half of the year, with a choppy market during the second half. That has been the case so far. It still suggests some further strength before a consolidation late summer into fall, then additional strength into year end.
A New Bull Market?
The major indices are up substantially from the October 12th bear market lows. There have been a lot of skeptics along the way saying this is just another bear market rally and new lows are in the offing. That has not been our expectation. Now there are several confirming technical points that support our conclusion that a new bull market began at the October lows. We now have two consecutive quarters of market gains. Dating back to the 1950s, two consecutive quarterly gains in the S&P 500 following bear periods, have always confirmed a new bull market as shown in Figure 4.
Figure 4: Two Consecutive Quarters of Gains Suggest New Bull Market
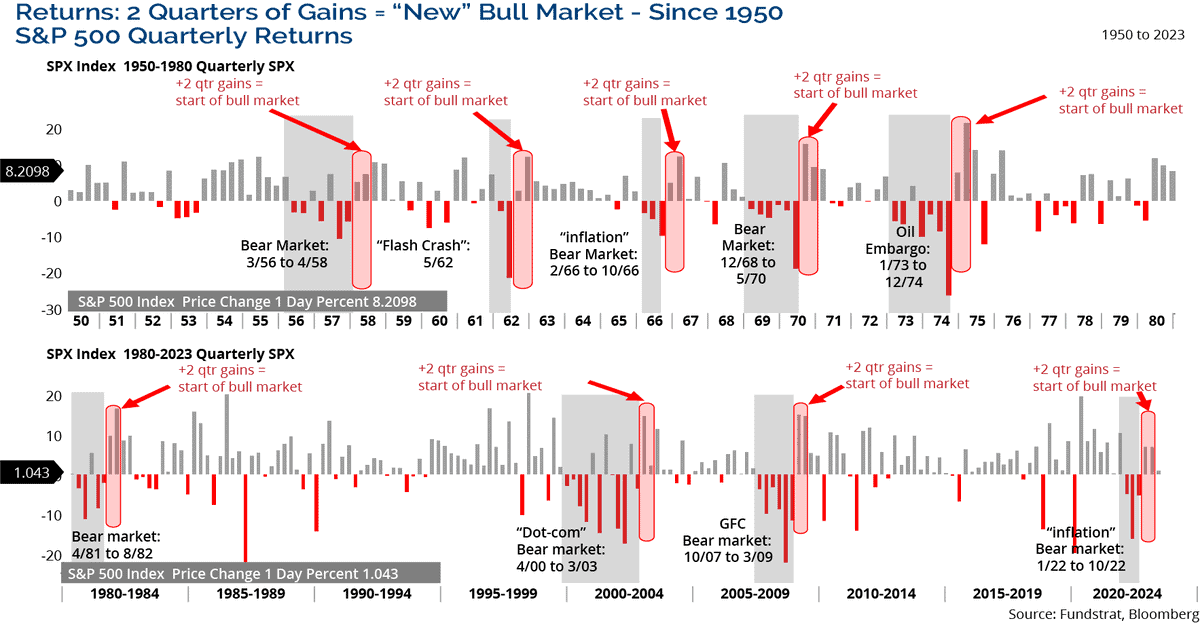
Source: Fundstrat, Bloomberg. For illustrative purposes only. Past performance is not indicative of future results. Projections or other forward looking statements regarding future financial performance of markets are only predictions
Also, in the post-WWII period, there have been 13 other periods in which the S&P 500 declined 20%+ from a 52-week high and then went at least seven months without breaching that low. The seventh-month mark this time was hit in May. In the prior cases the following one, three, six, and twelve-month performance has been better than the long-term average as well as more consistent to the upside. One year later, the only time the S&P 500 was lower was in 2001.
The market’s trend is now confirmed higher, with a series of higher highs and higher lows in the S&P 500 and other major indices. The S&P 500’s 50-day moving average had been above its 200-day moving average since early February, which is what technical analysts like to call a “Golden Cross.” It adds further confirmation that the primary trend of the market is higher.
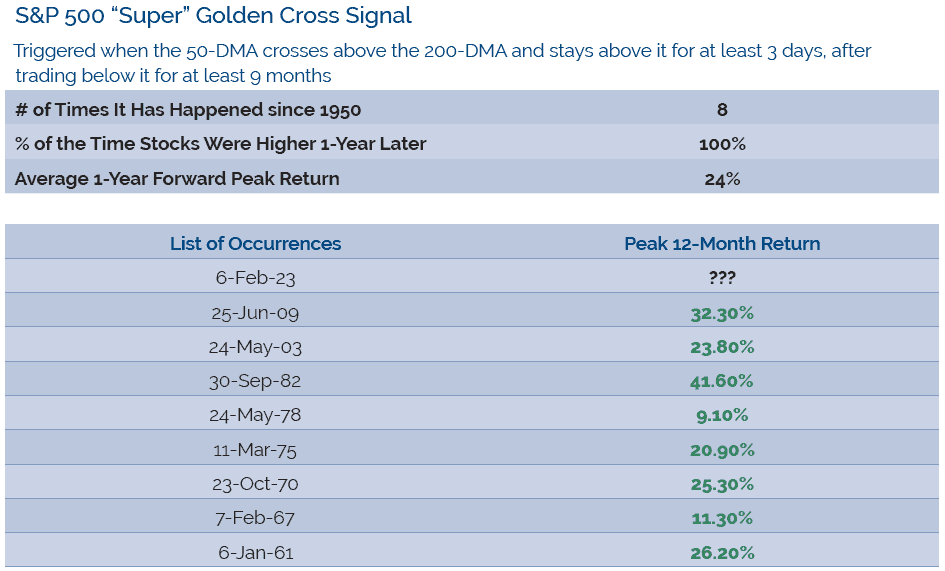
The Super Golden Cross is the modified version of the standard golden cross signal, and it has a 100% accuracy rate going back to 1950 in predicting further gains for the market.
It is triggered only after a long bear market, when the 50-day crosses above the 200-day MA and stays above it for at least three days, after spending at least nine months below it. Between 1950 and 2022, this Super Golden Cross signal was triggered only eight times. The average peak return for the S&P over the next 12-months has been 24% as shown in Figure 5.
Figure 5: Super Golden Gross Predicts Further Gains for the Market
Source: Yahoo Finance, Investor Place. For illustrative purposes only. Past performance is not indicative of future results.
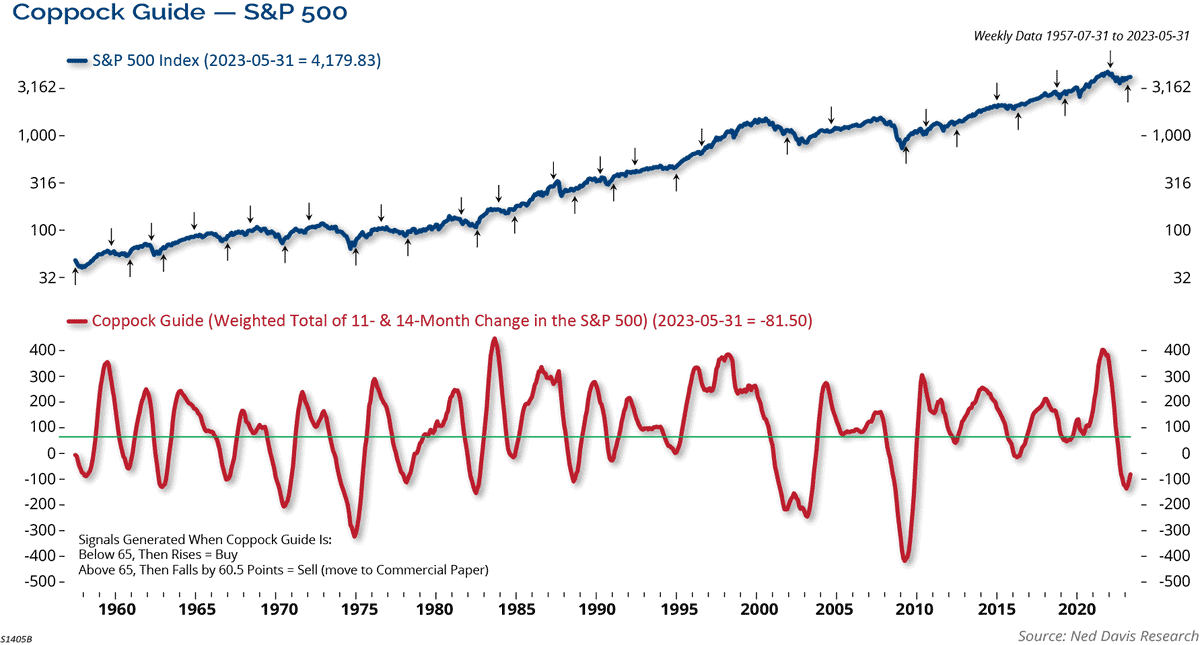
The Coppock Guide, a long-term momentum indicator, has been a highly reliable indicator over the past 60+ years, signaling “best buy” opportunities when it turns upward from below zero. It is currently in its third consecutive month of an upturn, indicating the potential for more upside to this new bull market.
Looking back at history, when the guide turns higher from a deeply oversold level as it did in March, the median max drawdown over the next year was only -2.01% with a median gain of 29.31% as shown in Figure 6 below. From the March 31st signal this time, the S&P 500 is up 7.7% with a max drawdown of 1.22%, consistent with the historical precedent of the guide.
Figure 6: Coppock Guide Indicates Upside Potential
Investor Sentiment Turning More Bullish
At the beginning of the year, investor sentiment was overly pessimistic. Even given the runup in stocks so far this year, investor sentiment is mixed at best. Individual investors have turned more bullish, there is record cash in money market funds, and Commitments of Traders (COT) reports show near-record short positions by speculators in S&P futures.
Typically, investor sentiment has been a contrarian indicator, meaning more pessimistic sentiment has preceded stronger returns for the market. Last year, investor sentiment remained bearish almost all year and as we entered 2023, we said, “pessimistic investor sentiment offers future bullish fuel for the markets.”
Now that the markets have surged more than 20% off the lows, individual investors, measured by the American Association of Individual Investors poll shown in Figure 7 below, showed one of the largest weekly sentiment shifts on record. Historically, the market has performed well with further gains over the intermediate term following other large sentiment surges from very depressed levels.
Figure 7: Large Sentiment Shift Suggest Further Gains in the Intermediate Term
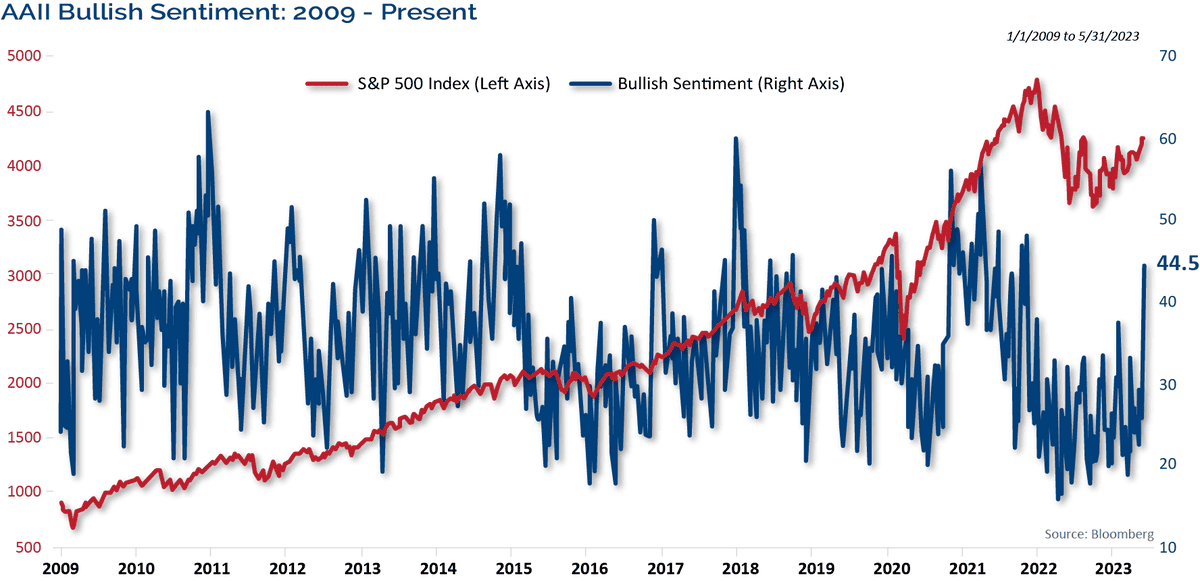
Source: Bloomberg. For illustrative purposes only. Past performance is not indicative of future results.
The CBOE Volatility Index (VIX) remained elevated throughout last year. The average VIX level for the year was just over 25. As we said in our Annual Outlook, there are only six years where VIX averaged greater than 2022 levels: 1998, 2001, 2002, 2008, 2009, and 2020. Volatility usually drops the following year after being elevated. In those cases, the S&P 500 posted gains in 5 of 6 years, with an average 14.3% gain.
True to script and as expected, volatility has plummeted. In fact, the VIX Index recently hit its lowest level since February 2020, just before the COVID collapse.
Low VIX signifies a certain element of complacency, but that signal is more powerful after a long period of calm and in conjunction with other topping signals like expensive valuations and transition from easy to tight policy. And history shows that lower volatility readings like this are actually most often found during boring bull markets.
Figure 8: Bears Capitulating
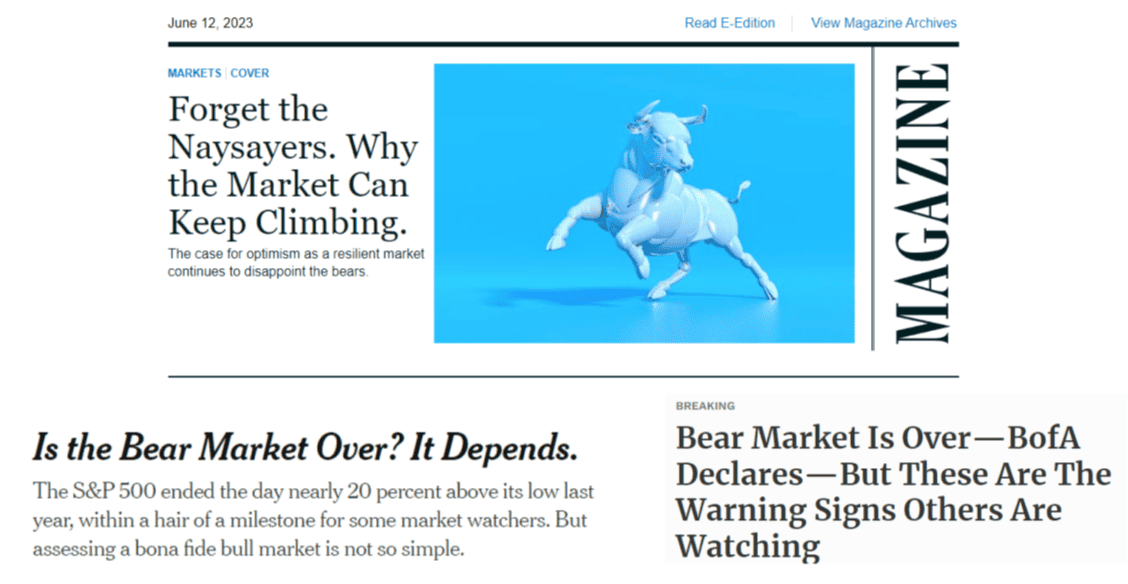
If a magazine cover is any indication of sentiment; then the recent cover of Barron’s in Figure 8 should raise alarms. It featured a picture of a bull with the story titled, “Don’t Fear the Bull Market. Why Stocks Are Headed Higher.” Many bearish strategists are capitulating, and after 20% gains from the lows, the bull market is becoming hard to ignore.
Meanwhile, positioning seems to be offsides with too much bearishness on the part of speculative futures traders. There is nearly a record net short position by the speculative trading and hedge fund community in S&P 500 futures contracts. This likely is a reason why the market has jumped over the past couple weeks. Managers are chasing that market higher and covering short positions as the macro environment turned more favorable with inflation coming down, the economy showing resiliency, and the Fed being in the late innings of the rate hike cycle.
Signs of Broader Market Participation
We have seen the most concentrated market of all-time. As shown in Figure 9, the top five stocks in the S&P 500 (AAPL, MSFT, AMZN, NVDA, GOOG) represent almost 25% of the index, a 50-year record! Mega-cap growth companies have dominated the market landscape. A byproduct of the concentration is inflated valuations for this cohort.
Figure 9: Top 5 Stocks Represent a Quarter of the Index
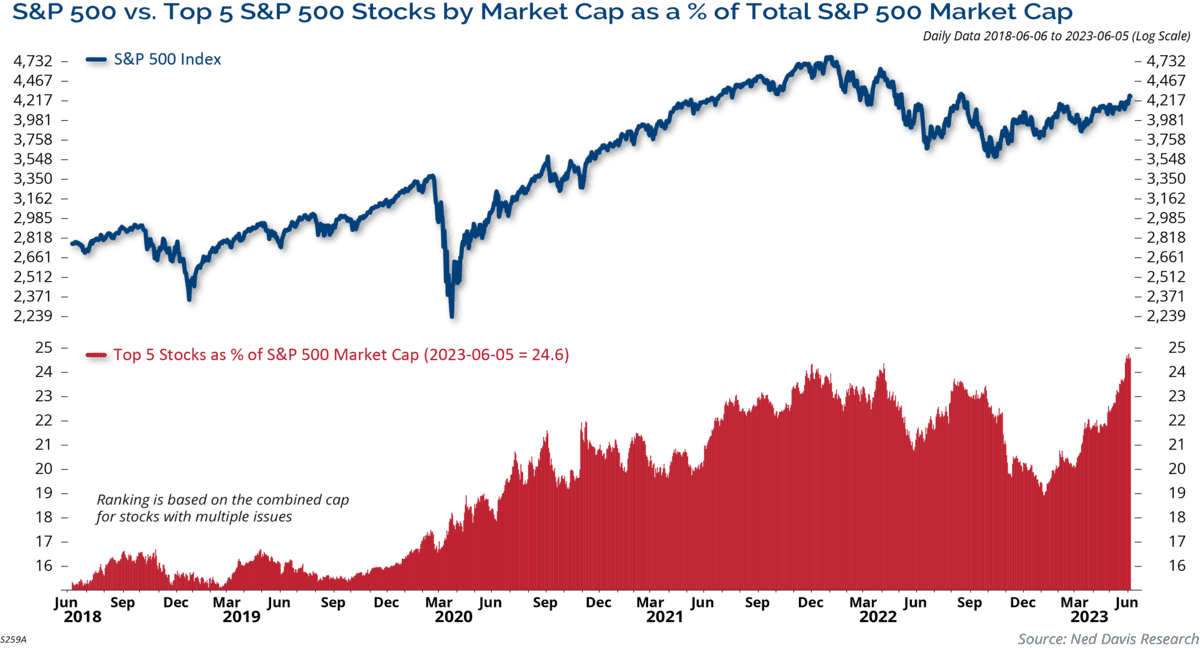
Source: Ned Davis Research. For illustrative purposes only. Past performance is not indicative of future results..
However, we are now beginning to see early signs of the market broadening out with more sectors participating in the recent advance, and participation improving among small-cap stocks and the equal weighted S&P. For example:
- 90% of S&P 500 names are trading above their 20-day moving averages
- The percentage of stocks above their 50 and 200-day moving averages has surpassed its April peak
- The S&P 500 Cumulative Advance-Decline Line hit a new all-time high
These are healthy developments that help support further gains, even if the market has a near-term correction.
Earnings Momentum Starting to Improve
Let’s turn to valuations. Having contracted for two consecutive years from strong earnings growth in 2021 and sharp price declines in 2022, the S&P 500 P/E multiples are near their long-term averages. The two-year change in the forward P/E and trailing operating P/E were the biggest on record.
The S&P 500 forward and trailing P/E ratios have turned higher. The trailing P/E ratio is almost 21. In large part that reflects the hefty valuations of the mega-cap Technology companies that have dominated the market. However, the P/E ratio for the S&P 500 excluding the FAANG stocks is much more reasonable at 14.8 times, hardly expensive.
The trend of earnings momentum has started to improve. With the negative earnings news from last year priced in, the market stands to benefit from the growing recognition that the earnings weakness has reached its extreme.
Figure 10 shows the percentage of companies with positive earnings revisions. Revisions bottomed in November and have risen for seven straight months. We believe that bodes well for an earnings recovery.
Figure 10: Positive Earnings Revisions Bode Well for Earnings Recovery
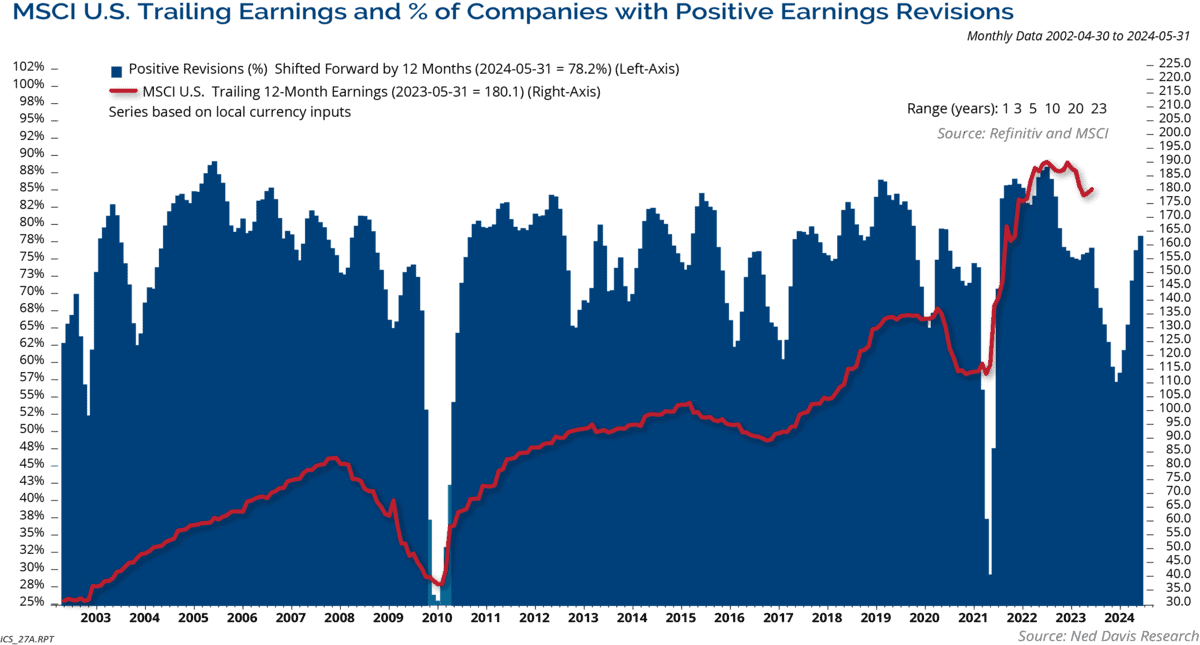
Source: Ned Davis Research. For illustrative purposes only. Past performance is not indicative of future results. Projections or other forward looking statements regarding future financial performance of markets are only predictions.
That is a positive influence on the market given the S&P 500’s performance after the 18 previous earnings troughs. The index has been up in 72% of the cases over the subsequent six and 12 months, with respective median gains of 8% and 12% over those periods.
The takeaway is that following the latest earnings trough, the implications are bullish. But a degree of caution will be in order until it’s clear that economic growth will continue to support earnings growth.
In Figure 11, we look at the long-term trend of earnings and stock prices. Naturally, stocks and earnings are correlated over time.
Figure 11: Stocks and Earnings Correlated Over Time
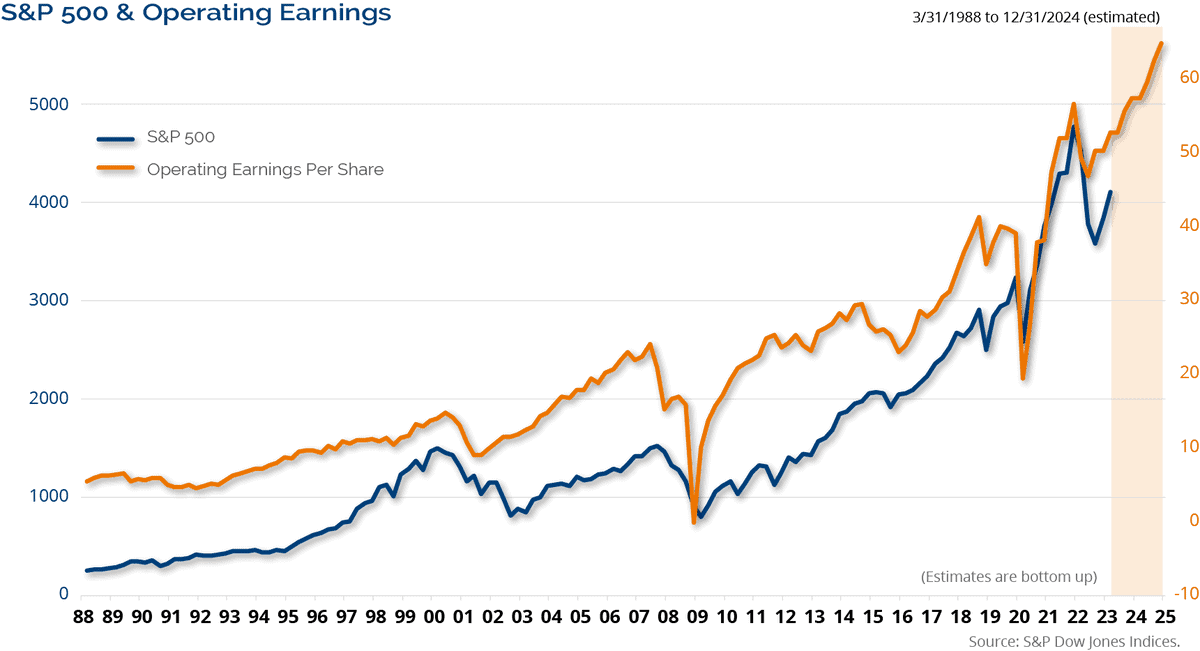
Source: S&P Dow Jones Indices. For illustrative purposes only. Past performance is not indicative of future results.
Inflation Is Falling Fast
Coming into 2023, analysts expected earnings to grow by 13.5%. That seemed unrealistic at the time given the headwinds facing the economy. We expected 5% earnings growth for the year; however, it looks like earnings will surpass our expectations. Currently, analysts expect 10.5% earnings growth for 2023 and 12% in 2024. We believe estimated revisions and higher forward earnings expectations provide a positive fundamental backdrop for the market into 2024.
The boogie man in the room over the past 18 months has been inflation. We expected inflation to slow and in our 2023 Annual Outlook we stated, “Inflation is set to continue moderating and could well be near the Fed’s target in the second half of the year. The Consumer Price Index (CPI) year over year should fall to 3% with the potential for a downside surprise. Base effects, slowing housing data, and commodity round trips support the moderation of inflation.” Inflation is falling fast. Producer prices (PPI) are up only 1.4% year over year. The rate of decline in PPI from its peak has been steeper than the slope of the increase in the runup of inflation.
Consumer prices are still a bit elevated, up 4% year over year. The primary reasons are used car prices and shelter costs. 34% of headline CPI is shelter costs. The shelter component of CPI is up 8% year over year, contributing 2.7 percentage points to overall CPI over the past year.
There is positive news on the shelter front though with rents flat over the past 12 months. Real Page’s survey of rents slowed to +2.3% in May versus its peak of +15.6% year over year. Redfin’s latest survey of rents declined -0.6% year over year in May. The shelter component of CPI is likely to slow significantly for the rest of the year, putting downward pressure on CPI over the coming months.
M2 Money Supply growth should also continue contributing to slowing inflation. M2 money growth has declined 4.6% year over year, one of the largest declines on record. In our Annual Outlook we said, “The lack of money supply growth now should act like an anchor in pulling the inflation rate lower.” That continues to be the case today.
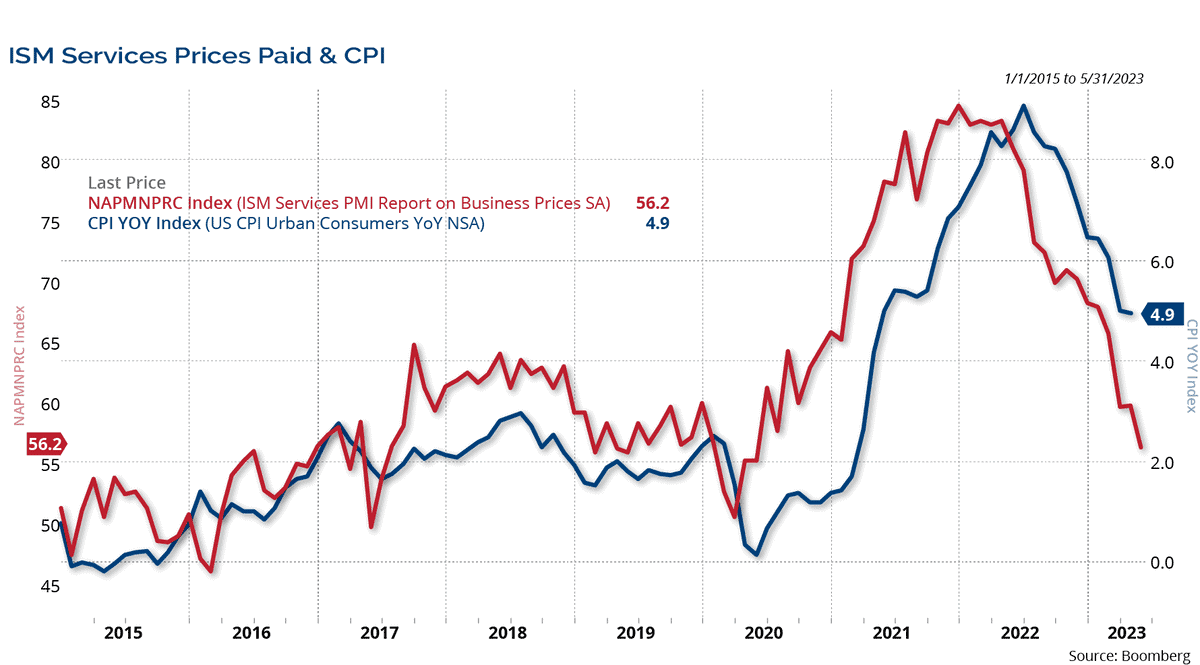
Another inflation statistic that signals lower inflation is the ISM Services Prices Paid Index. Services account for 61.5% of the CPI. So, it’s not surprising that the CPI inflation rate on a year-over-year basis is highly correlated with the ISM Services prices paid index.
In Figure 12, the May ISM prices paid component recently fell to its lowest level in two years (since May 2020). The ISM Services Prices Paid leads CPI by about 6 months, suggesting that CPI falls towards our 3% target or lower by year end.
Figure 12: ISM Prices Paid Suggests CPI Falls Towards Target by Year End
Fed Nears End of Rate Hike Cycle
Turning to the Fed, they don’t want to see inflation expectations elevated to unsustainable levels. Market-based inflation expectations continue to be anchored with 5, 7, 10, and 30-year inflation breakeven rates hovering around 2%.
Also, the University of Michigan’s one-year inflation expectations survey fell to its lowest level since March 2021. This is in line with our outlook for the disinflation trend to continue in the coming months. It also supports the Fed’s decision to pause and be data-dependent for policy decisions in the near term.
Fed officials have said that their goal was to raise the federal funds rate up to a “restrictive” level and to keep it there until inflation falls closer to their 2.0% target. The fed funds rate is now set to a range of 5.0-5.25%, having lifted overnight rates by a record 500 basis points in just 15 months. After ten consecutive rate hikes, the Fed paused in June.
Is the Fed done hiking rates or are there more hikes to come? The market is currently pricing in one more rate hike at the July FOMC meeting. Either way, we believe we are nearing the end of the rate hike cycle. What happens with yields after the Fed finishes a rate hike cycle? Yields usually drop between the last rate hike and the first rate cut. Of the ten prior cycles after the Fed’s last rate hike, yields fell in nine of them. On average, 10-year Treasury yields were down around 72 basis points. The only time yields rose was from 1969-1970.
Conclusion
Zooming out and taking a look at the very long term, we believe the secular bull market in stocks is intact and we expect new highs in the major indices. As shown in Figure 13, the S&P 500 is about 10% below its all-time high and we think it eclipses that level over the next 12 months.
Figure 13: Secular Bull Market Remains Intact
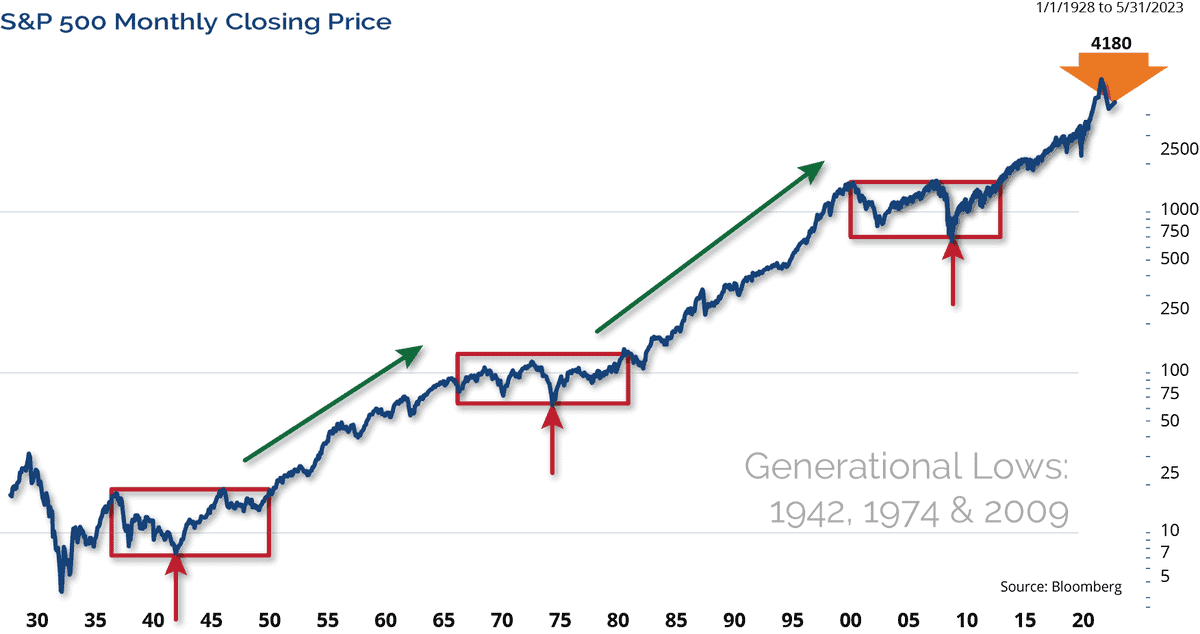
Source: Bloomberg. For illustrative purposes only. Past performance is not indicative of future results.
Halfway through 2023, calls for recession have fallen on deaf ears and the economy continues expanding on the back of a strong labor market. Economic growth should moderate in the second half of the year with inflation continuing to fall.
We believe the Fed is in the very late innings of the rate hike cycle, and history illustrates that yields usually decline after the last rate hike. Stocks have rarely declined in back-to-back years, and the market is following the script laid out by the Cycle Composite for this year, which showed the potential for gains to be front loaded before a second half consolidation. Mega-cap growth has led the indices higher, but we are now beginning to see signs of participation broadening out. Therefore, we increased our S&P 500 target for this year from 4200 to 4500. As always, we believe that clients should be focused on their long-term goals and objectives, and should not be derailed by short-term swings in the markets.
Eager for More Insights? Visit our 2023 Mid-Year Market Outlook Resource Center.
The opinions expressed are those of Clark Capital Management Group. The opinions referenced are as of the date of publication and are subject to change due to changes in the market or economic conditions and may not necessarily come to pass. There is no guarantee of the future performance of any Clark Capital investment portfolio. Material presented has been derived from sources considered to be reliable, but the accuracy and completeness cannot be guaranteed. Nothing herein should be construed as a solicitation, recommendation or an offer to buy, sell or hold any securities, other investments or to adopt any investment strategy or strategies. For educational use only. This information is not intended to serve as investment advice. This material is not intended to be relied upon as a forecast or research. The investment or strategy discussed may not be suitable for all investors. Investors must make their own decisions based on their specific investment objectives and financial circumstances. Past performance does not guarantee future results.
This document may contain certain information that constitutes forward-looking statements which can be identified by the use of forward-looking terminology such as “may,” “expect,” “will,” “hope,” “forecast,” “intend,” “target,” “believe,” and/or comparable terminology (or the negative thereof). No assurance, representation, or warranty is made by any person that any of Clark Capital’s assumptions, expectations, objectives, and/or goals will be achieved. Nothing contained in this document may be relied upon as a guarantee, promise, assurance, or representation as to the future.
Clark Capital Management Group, Inc. is an investment adviser registered with the U.S. Securities and Exchange. Commission Registration does not imply a certain level of skill or training. More information about Clark Capital’s advisory services can be found in its Form ADV which is available upon request.
The Barclays U.S. Corporate High-Yield Index covers the USD-denominated, non-investment grade, fixed-rate, taxable corporate bond market. Securities are classified as high-yield if the middle rating of Moody’s, Fitch, and S&P is Ba1/BB+/BB+ or below.
Index returns include the reinvestment of income and dividends. The returns for these unmanaged indexes do not include any transaction costs, management fees or other costs. It is not possible to make an investment directly in any index.
Fixed income securities are subject to certain risks including, but not limited to: interest rate (changes in interest rates may cause a decline in market value or an investment), credit, prepayment, call (some bonds allow the issuer to call a bond for redemption before it matures), and extension (principal repayments may not occur as quickly as anticipated, causing the expected maturity of a security to increase).
Non-investment-grade debt securities (high-yield/junk bonds) may be subject to greater market fluctuations, risk of default or loss of income and principal than higher-rated securities
The S&P 500 measures the performance of the 500 leading companies in leading industries of the U.S. economy, capturing 75% of U.S. equities.
The Russell 1000 Value Index measures the performance of the large-cap value segment of the U.S. equity universe. It includes those Russell 1000 companies with lower price-to-book ratios and lower expected growth values.
The Russell 1000 Growth Index measures the performance of the large-cap growth segment of the U.S. equity universe. It includes those Russell 1000 Index companies with higher price-to-book ratios and higher forecasted growth values.
The Russell 1000 Index measures the performance of the large-cap segment of the U.S. equity universe. It is a subset of the Russell 3000® Index and includes approximately 1000 of the largest securities based on a combination of their market cap and current index membership. The Russell 1000 represents approximately 92% of the U.S. market.
The Russell 2000 Index measures the performance of the 2000 smallest U.S. companies based on total market capitalization in the Russell 3000, which represents approximately 10% of Russell 3000 total market capitalization.
The Russell 3000 Index measures the performance of the 3000 largest U.S. companies based on total market capitalization, which represents approximately 98% of the investable U.S. equity market.
The MSCI Emerging Markets Index is a free float-adjusted market capitalization index that is designed to measure equity market performance of emerging markets. The MSCI Emerging Markets Index consists of the following 21 emerging market country indices: Brazil, Chile, China, Colombia, Czech Republic, Egypt, Hungary, India, Indonesia, Korea, Malaysia, Mexico, Morocco, Peru, Philippines, Poland, Russia, South Africa, Taiwan, Thailand, and Turkey.
The MSCI World ex US Index is a market capitalization-weighted index designed to measure equity performance in 22 global developed markets, excluding the United States. The benchmark for this composite is used because the MSCI World Ex US Net Index is generally representative of international equities.
BBgBarc U.S. Aggregate Bond Index covers the U.S. investment-grade fixed-rate bond market, including government and credit securities, agency mortgage pass-through securities, asset-backed securities and commercial mortgage-based securities. To qualify for inclusion, a bond or security must have at least one year to final maturity, and be rated investment grade Baa3 or better, dollar denominated, non-convertible, fixed rate and publicly issued.
The BBgBarc US Treasury Index measures US dollar-denominated, fixed-rate, nominal debt issued by the US Treasury. Treasury bills are excluded by the maturity constraint but are part of a separate Short Treasury Index. STRIPS are excluded from the index because their inclusion would result in double-counting. The US Treasury Index is a component of the US Aggregate, US Universal, Global Aggregate and Global Treasury Indices.
The BBgBarc US Corporate Bond Index measures the investment grade, fixed-rate, taxable corporate bond market. It includes USD-denominated securities publicly issued by US and non-US industrial, utility and financial issuers. The US Corporate Index is a component of the US Credit and US Aggregate Indices, and provided the necessary inclusion rules are met, US Corporate Index securities also contribute to the multi-currency Global Aggregate Index.
The BBgBarc U.S. Corporate High-Yield Index covers the U.S. dollar-denominated, non-investment grade, fixed-rate, taxable corporate bond market. Securities are classified as high-yield if the middle rating of Moody’s, Fitch, and S&P is Ba1/BB+/BB+ or below.
The BBgBarc U.S. Municipal Index covers the USD-denominated long-term tax-exempt bond market. The index has four main sectors: state and local general obligation bonds, revenue bonds, insured bonds and prerefunded bonds.
The Global Manufacturing PMI™ indices are all seasonally adjusted. The seasonal adjustment is applied at the national level (as opposed to at the global aggregate level) in order to account for differing seasonal patterns in each of the nations included. Global Manufacturing PMI™ indices are weighted according to national contributions to global manufacturing gross value added. Weights for the global indices are derived from the latest available World Bank data on the gross value added of manufacturing for each of the nations covered. World Bank data on value added are in constant 2010 US$, with all national currencies converted to 2010 US$ by the World Bank using DEC alternative conversion factors.
The NDR Credit Conditions Indices (CCI) are designed to objectively measure credit conditions in the U.S. market, specifically the cost & availability of credit. The index consists of two equal-weighted components and historically evaluates business and consumer credit conditions.
NDR (Ned Daily Research) Daily Trading Sentiment Index is based on the S&P 500 Daily Sentiment Index which shows a short-term sentiment view of the S&P 500 Index
Created by the Chicago Board Options Exchange (CBOE), the Volatility Index, or VIX, is a real-time market index that represents the market’s expectation of 30-day forward-looking volatility. Derived from the price inputs of the S&P 500 index options, it provides a measure of market risk and investors’ sentiments.
The 10-year Treasury note is a debt obligation issued by the United States government with a maturity of 10 years upon initial issuance. A 10-year Treasury note pays interest at a fixed rate once every six months and pays the face value to the holder at maturity.
The Dow Jones Industrial Average is the most widely used indicator of the overall condition of the stock market, a price-weighted average of 30 actively traded blue chip stocks, primarily industrials. The 30 stocks are chosen by the editors of the Wall Street Journal (which is published by Dow Jones & Company), a practice that dates back to the beginning of the century. The Dow is computed using a price-weighted indexing system, rather than the more common market cap-weighted indexing system.
Index returns include the reinvestment of income and dividends. The returns for these unmanaged indexes do not include any transaction costs, management fees or other costs. It is not possible to make an investment directly in any index.
The volatility (beta) of an account may be greater or less than its respective benchmark.
The Consumer Price Index (CPI) measures the change in prices paid by consumers for goods and services. The CPI reflects spending patterns for each of two population groups: all urban consumers and urban wage earners and clerical workers. CCM-672
![]()
