Diving Into Market Uncertainties
Highlights
We believe:
- The economy has defied the naysayers and remained very strong in the face of recession calls. Through Q3 2023, the economy has grown at a 3.0%+ annualized rate. We expect the economy to continue to grow, but at a slower pace of 2.25% in 2024.
- Presidential election year trends suggest a positive year for the market, with gains loaded in the back end of the year. Our target for the S&P 500 in 2024 is 5300.
- There are signs of broadening market participation, and small-cap stocks look attractive relative to large-caps.
- Inflation is set to continue moderating with supply chains healed. Used car prices and the lagged effect of housing suggest that inflation is set to continue a glide path lower toward 2%.
- The Federal Reserve has finished rate hikes with multiple rate cuts being priced into the markets. While the market is pricing in 6 cuts in 2024, we believe 4 cuts are more realistic.
- The 10-year Treasury note yield is set to remain rangebound between 3.25% – 4.5%. The yield curve historically steepens after the last rate hike.
- Risks to the Market Outlook include a hard landing, the U.S. presidential election, geopolitics (Russia/Ukraine, Middle East, China/Taiwan), and the U.S. government’s fiscal position.
Looking Back
2023 turned out to be a great year for the markets, which was contrary to popular opinion coming into the year. Many analysts and economists were predicting a recession, continued pain on the inflation front, and another year of losses for both stocks and bonds. Last year confounded many as the economy remained more resilient. Despite the Fed continuing to hike overnight rates into the middle of the year, inflation came down and stocks soared.
In our 2023 Market Outlook, there were several themes we highlighted that prompted us to be bullish on stocks and hold out hope for a soft landing. For example, we expected the 2022 macro headwinds to turn into tailwinds in 2023 and therefore, we had a bit more of an optimistic view of the potential for the economic momentum to carry over into 2023. We also said it is rare for the S&P 500 to post back-to-back negative years of return. Additionally, pre-election years have historically been the strongest of the presidential election cycle, with median gains in the S&P 500 of 16.8%. Finally, inflation was set to continue moderating and we said that the year-over-year Consumer Price Index (CPI) should fall to 3% with the potential for a downside surprise. That script played out even better than we expected. It reminded me of the quote by Hannibal Smith of the A-Team, “I love it when a plan comes together.”
Most of the year was characterized by a concentrated equity market rally with the elite eight stocks dominating. The tides shifted once it became clear that the Fed was done hiking rates. Market participation broadened to include value, small-cap, and mid-cap stocks. As shown in Figure 1, for the year, the S&P 500 gained 26.26%, the Russell 2000 gained 16.88%, and the MSCI ACWI ex-US added 15.62%. Growth led the way with the Russell 1000 Growth Index up 42.67% and the Value Index up 11.41%.
Figure 1. Perspective
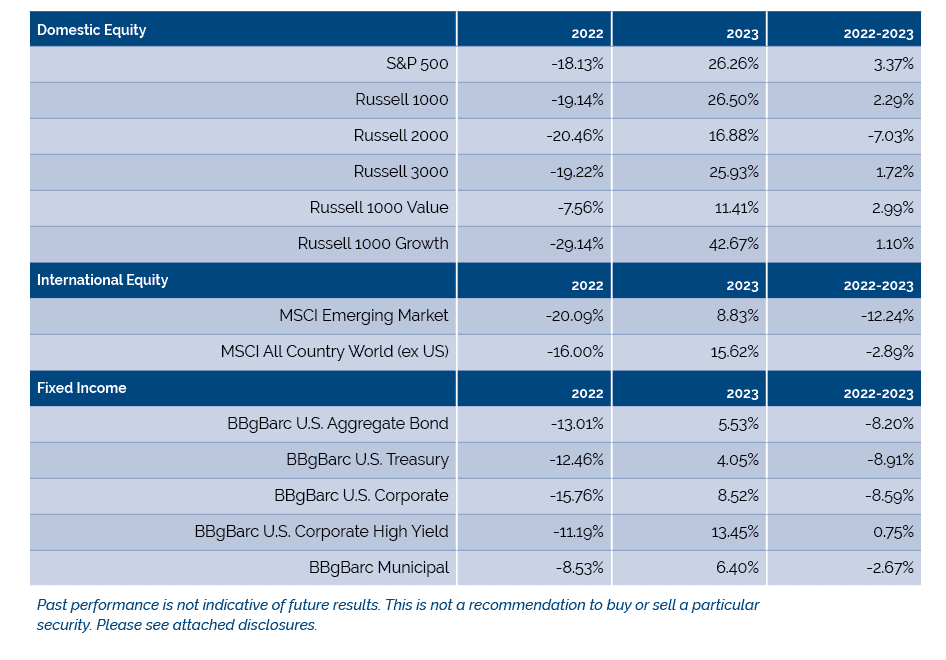
Shifting interest rate expectations and decelerating inflation were a boon for bonds over the last two months of the year. The bond market avoided an unprecedented third year in a row of declines. High yield led the way up 13.45% and Treasuries gained 4.05%. We believe the markets enter the New Year overbought with overly optimistic investor sentiment.
As we turn the calendar and look toward 2024, we are cautiously optimistic on the economy and the markets. We see potential for continued gains, but at a much more moderate pace than we had last year. The economy certainly defied the naysayers last year and remained resilient in the face of recession calls. Through the third quarter, the economy grew at better than a 3.0% annualized rate. While the recession versus soft landing debate continues, we think the evidence is building in favor of a soft landing, and therefore expect the economy to grow by 2.25% in 2024.
To be sure, economic indicators including Leading Indicators, the yield curve, and the cumulative effect of monetary tightening remain recession concerns. However, we believe solid labor market conditions, economic momentum, a more dovish Fed, and decelerating inflation counter these concerns. In our 2023 Outlook we said, “until meaningful weakness is revealed in the labor market, calls for recession seem premature.” We believe that remains the case today.
Overly bullish investor sentiment as we enter the New Year highlights the potential for consolidation in the first half of the year. Presidential election year trends suggest a positive year for the market, with gains loaded in the back half of the year. Our target for the S&P 500 based on election year trends, continued earnings growth, and some modest multiples expansion is 5300. We believe there are signs of broadening participation; small-cap stocks look attractive relative to large-caps.
In our opinion, inflation is set to continue moderating as supply chains have healed. Used car prices and the lagged effect of housing suggest disinflation is set to continue. As a result, we believe inflation is on a glide path lower toward 2%. The Federal Reserve has finished rate hikes with multiple rate cuts being priced into the markets. We view this as a recalibration of Fed policy. Historically, the Fed cuts rates seven months after the last hike. The market is pricing in a total of six cuts in 2024. However, we believe that is likely too aggressive and instead, we are projecting a total of four cuts.
The 10-year Treasury yield peaked in October at 4.99% and did a round trip ending the year at 3.86%, just 2 basis points (bps) points from where it started the year. We expect the 10-year yield to be rangebound between 3.25% – 4.5% and for the yield curve to steepen, which is consistent with historical precedent after the last Fed rate hike.
Every year there are risks to the Outlook and this year is no different. Those risks include a hard economic landing, the U.S. presidential election (if a clear winner is not decided on Election Day), geopolitics (Russia/Ukraine, the Middle East, China/Taiwan), and the tenuous U.S. government fiscal position.
There is an almost universal belief that the U.S. economy is on course for a soft landing. The two most compelling arguments fueling that belief are easing inflation and a persistently strong labor market. The economy also carries a bit of momentum with it into the New Year. As shown in Figure 2, through the first three quarters of 2023, the economy grew at better than a 3.0% annualize rate, and the Atlanta Fed’s GDPNow is forecasting 2.5% growth in Q4. We expect the economy to continue its expansion, but growth should moderate to 2.25% in 2024.
Figure 2: GDP Set to Moderate in 2024
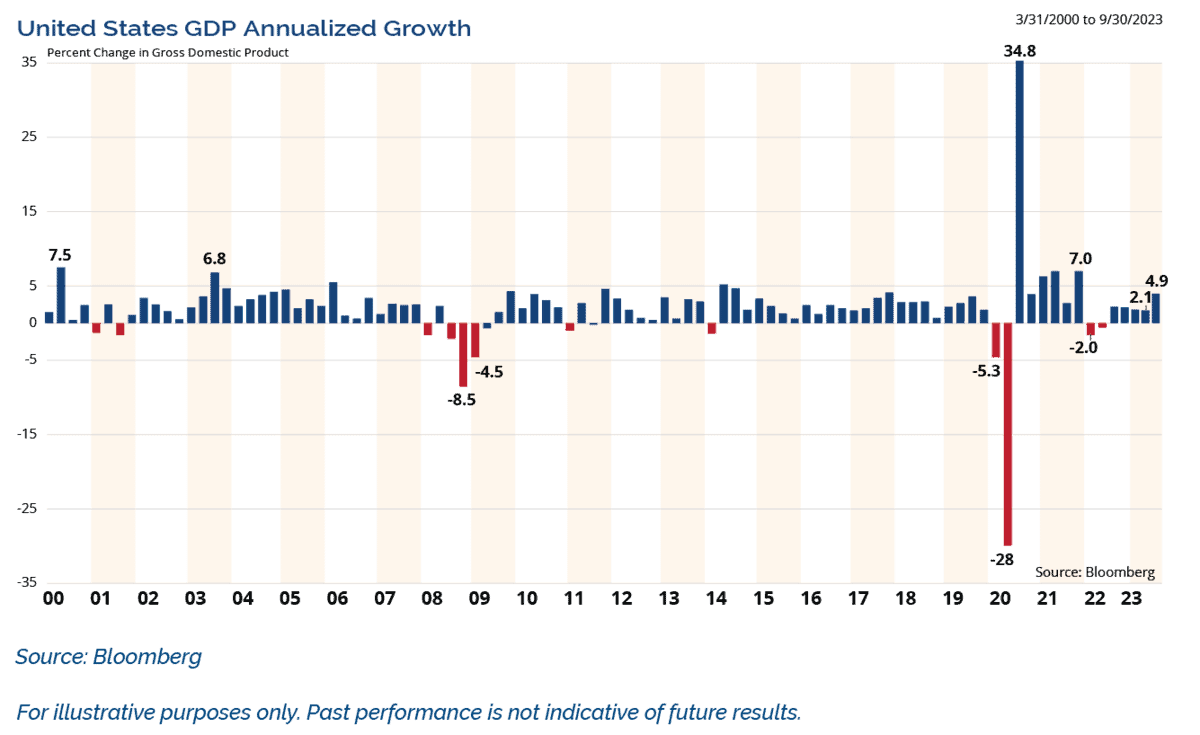 Continued Growth, but Slowing Down
We see several areas that are likely to support modest growth in the year ahead.
(1) Residential investment: Housing starts are running well above housing completions, which means that housing units under construction will need to rise.
(2) Equipment investment: As growth expectations softened last year, firms cut back on investment. Real equipment spending has dropped for three of the last four quarters. It’s hard to see this streak continuing given the rebound in corporate confidence.
(3) Consumption: Real personal income has climbed roughly 3% against last year as price inflation has cooled and labor markets remain on steady footing.
(4) Finally, all measures of inflation have been declining rapidly as anticipated. This precipitous drop is one of the most convincing arguments for a “soft landing” and, combined with other strengths in the economy, makes this scenario seem more likely.
A primary reason for today’s economic robustness lies in the resilience of the labor market. The unemployment rate is near its lowest level in over 50 years. In addition, unemployment claims are near record lows with no shift in sight.
We are closely watching the unemployment rate. Increases in the rate of at least 0.6% from a cyclical low have confirmed the onset of nearly every recession over the past 65 years, with only one false signal in 1959. The unemployment rate low for this cycle was 3.4%. It rose to 3.9% in October before falling back down to 3.7% in December. A rise in the unemployment rate to 4.0% or higher would be a sign of caution. The recent December Employment Report showed that aggregate hours worked over the last three months are flat. We believe this implies a rise in labor productivity and a drop in unit labor costs. Therefore, we believe there is not much of an inflationary impulse in this labor data to be concerned about.
Inflation was a driver of the surge in yields and heightened volatility in the bond market over the past two years. However, inflation was transitory after all, and the Fed should have stuck with that narrative. It turned out to be mostly attributable to the shocks and aftershocks of the pandemic, which have been dissipating.
Inflation has come down at a faster pace than the Fed’s own forecast and faster than in previous inflation spikes. As shown in Figure 3, the Consumer Price Index (CPI) rose 3.1% year over year (YoY) while the Producer Price Index (PPI) has risen just 0.9% YoY, which was down from peaks of 9.1% and 11.1%, respectively. In our 2023 Market Outlook we said, “CPI should fall to 3% with the potential for a downside surprise.” That has now played out, and we expect further moderation of inflation in 2024.
Figure 3: Inflation Falling Faster Than Projected
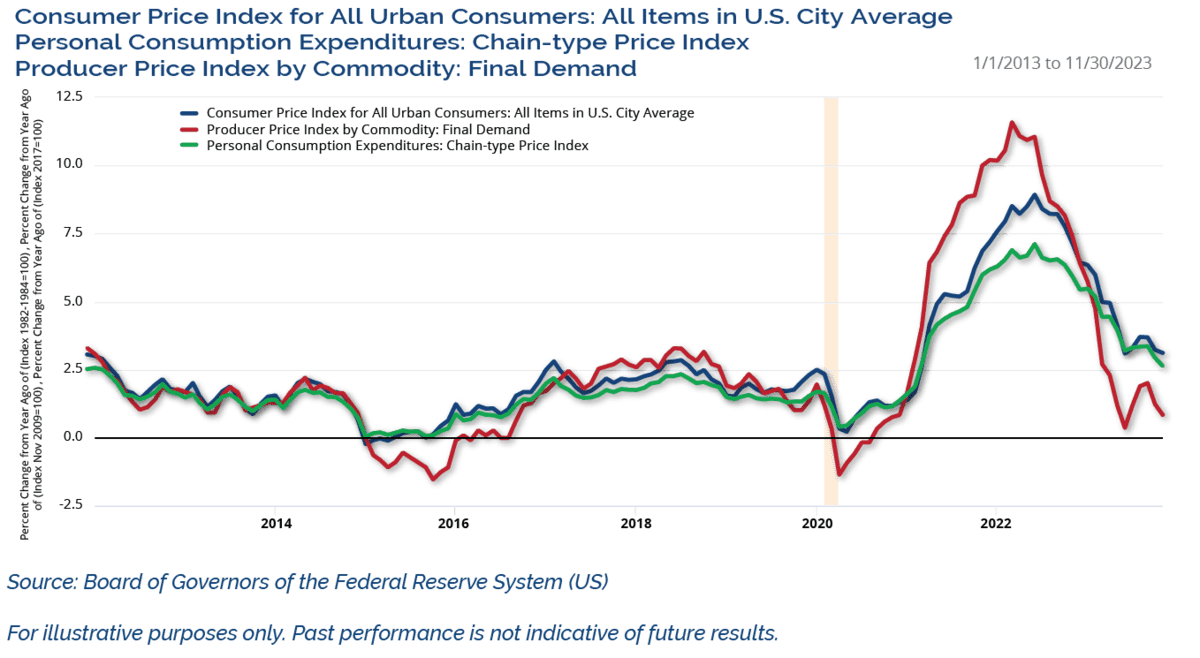
We believe inflation remains on a path lower and is heading towards the 2% range in the second half of 2024. The Fed’s preferred inflation gauge, Core Personal Consumption Expenditures (PCE), is already running at just a 1.9% YoY rate over the past 6 months. We believe inflation has additional room to decrease for several reasons. Both used car prices and shelter are currently deflating, impacting inflation statistics with a lag. Additionally, agricultural commodities are experiencing a decline, influencing food prices with a delay. As a result, we believe there is further disinflation in the pipeline.
Could This Time Be Different?
Economic indicators including the Conference Board’s Index of Leading Economic Indicators (LEI) and the yield curve have been warning of a coming recession since the beginning of last year. Leading Indicators have historically been a reliable tool in forecasting recessions. Over the past 65 years, there have been nine recessions. The average lead time between the peak in leading indicators (LEI) and the onset of recessions has been 11 months, without exception. However, the current scenario raises the question: could this time be different? Presently, the Leading Indicators have experienced a decline for 20 consecutive months.
We have never had such a streak without already being in recession, and it completely missed the reacceleration of growth in the second half of last year. With the Federal Reserve now seemingly adopting a more dovish bias, robust employment, and signs of stabilization in the manufacturing sector, this might be the LEI’s first failed recession call.
Short-term Treasury yields hit their highest levels since 2000 while the rest of the Treasury term structure saw yields hit their highest levels since 2006 and 2007. The front end peaked early and fell in March in response to the banking system’s liquidity issues and never returned to those peaks; however, the long end was more stubborn with 10+ year rates not peaking until October.
The yield curve has been inverted for well over a year and reached uncharted territory. The spread between the 10-year and 3-month yields has been inverted for 298 trading days through the end of 2023. Going back to 1962, there has never been a longer streak of inverted readings. With the equity market trading near new highs and economic data holding up, the predictive ability of the yield curve is being questioned. There have been false signals, such as in the mid-1960s and in 1998 when it briefly inverted and no recession materialized. This could be the third false alarm.
In last year’s Market Outlook, we quoted Professor Harvey Campbell who pioneered using the yield curve as a recession indicator. He said the yield curve signal may be less predictive this time and, “we could dodge the bullet. We could avoid the hard landing and if a recession arrives, it will be mild.”
Despite remaining inverted, the yield curve has started to normalize and steepen. History shows that after every yield curve inversion dating back to 1980, the curve normalized with a bullish steepening. Yields at the front-end of the yield curve fell faster than the long end, steepening the yield curve.
With July now the last rate hike in this tightening cycle, the yield curve bottomed right on cue. Historical studies show that the curve steepens from the last rate hike to the first rate cut by an average of 50 basis points. Also, in nine of the past ten cases, the curve was in positive territory by the time the Fed started cutting rates. We expect the curve to steepen throughout the year.
What’s in Store for Stocks?
Now, let’s turn to the equity markets. The Ned Davis Research Cycle Composite shown in Figure 4 combines the one-year cycle, four-year cycle (election years), and decennial cycle into a single composite. It can be a good guide as to how the market may trend in a given calendar year. In our 2023 Market Outlook we said, “The Composite for this year suggests a strong year, with gains front loaded in the first half of the year. This paints a bullish picture for the soft landing case, no recession, in which the market would respond favorably.” That script played out to a tee, with the market peaking in late July, correcting into the fall, and finishing with a strong year-end rally as the Composite suggested.
Figure 4: Cycle Composite Suggests a Choppy First Half of the Year and Stronger Second Half
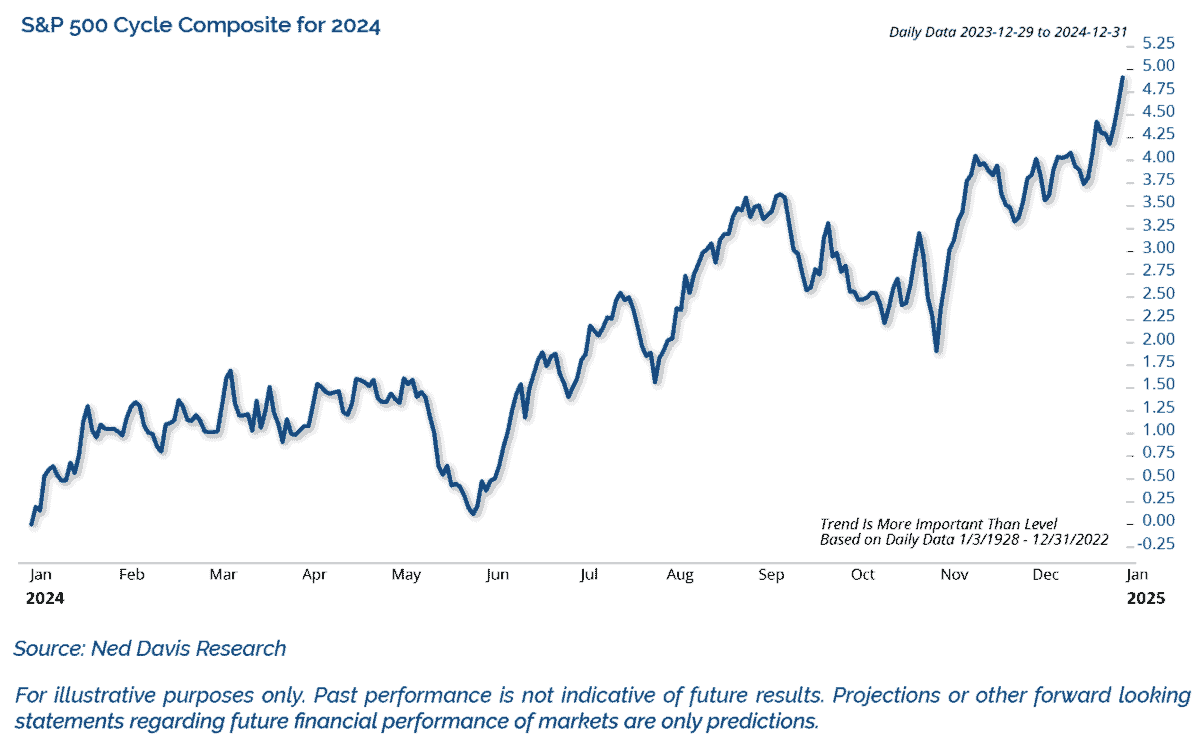
Turning to this year, the Cycle Composite suggests a choppy market into the summer, which would buy the market time to consolidate its large gains from last year. It also suggests a strong rally in the second half of the year. This playbook is also consistent with the normal presidential election year trends, as we will see below.
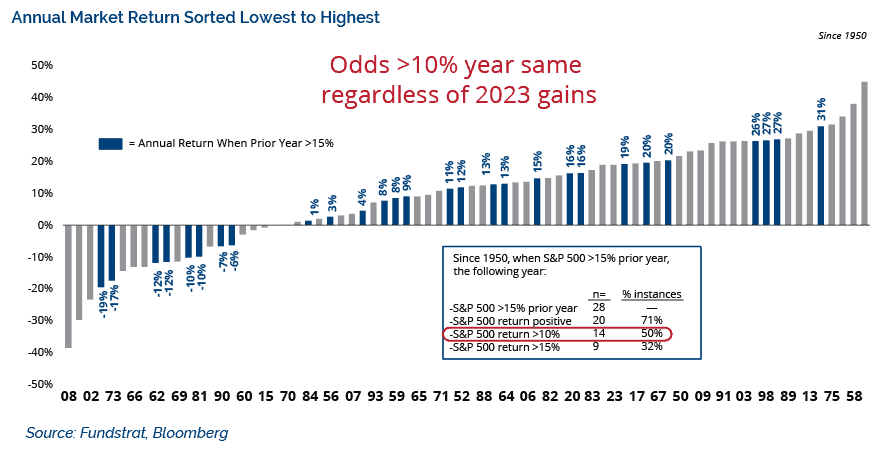
Dating back to 1950, in over half of the calendar years, the market gains 10% or more. Given that 2023 was such a strong year with the S&P 500 up 26%, many people believe the market “stole” gains from this year. However, the data suggests otherwise. As shown in Figure 5, the S&P 500 was up greater than 15% in the prior year, the market posted gains the next year 70% of the time, and 50% of the time, it gained more than 10%. This would suggest that history sides with 2024 being another good year for stocks.
Figure 5: History Suggests Another Positive Year Ahead
2024 is a presidential election year. As shown in Figure 6, since WWII, election years have been the second strongest of the 4-year Presidential Cycle, with a median gain of 10.7% and gains in 83% of those years. Historically, election years tend to exhibit a consistent pattern of weakness and consolidation early in the year followed by strength in the second half of the year.
Figure 6: Election Years are Historically Positive for Stocks
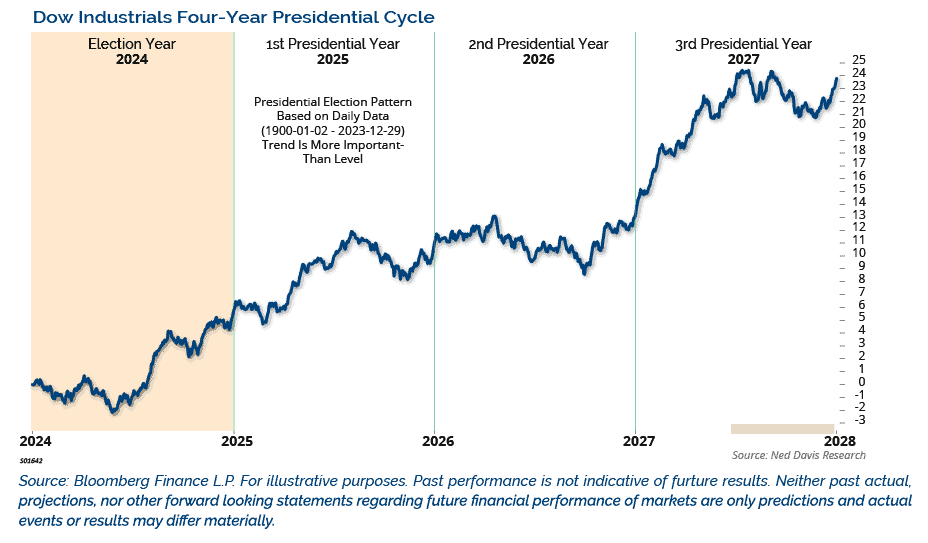
On average, the stock market bottoms during May of election years, but the standard deviation around that is quite large. The market usually bottoms and rallies once election uncertainty lifts. Given today’s political climate and the possibility of a very close race, election uncertainty could hang above the market longer than usual. Only time will tell how this election year plays out.
How Will Investors Respond?
Last year, the S&P 500 gained 26.3%, yet many investors remained cautious as they expected the U.S. economy to dip into recession and perceived the Fed to be a hostile threat to the markets. As we move into 2024, investor skepticism has diminished and turned too bullish in our opinion. Investor sentiment is a contrarian indicator, and contrary to last year, many sentiment surveys are at optimistic extremes. For example, the Ned David Research Trading Sentiment Composite is at an extreme, which highlights the potential for the market to stall and correct early in 2024.
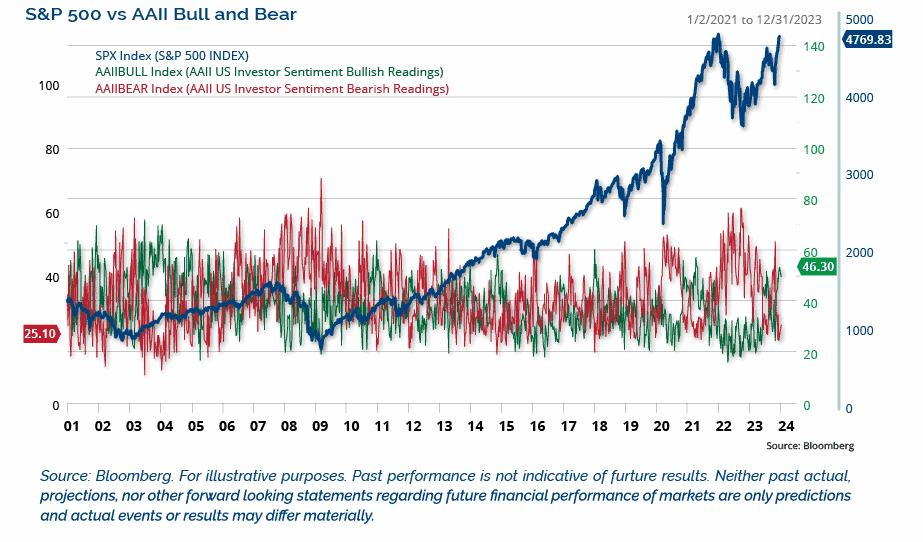
In addition, the American Association of Individual Investors sentiment poll, as shown in Figure 7, reached extreme levels of bullishness not seen since pre-COVID. The percentage of investors that were bearish hit a low of 19.3% in December, the lowest since 2018. While we are overall positive on equities, the weight of the evidence suggests much of the gains could come in the second half of the year.
Figure 7: AAII Sentiment Poll Reached Pre-COVID Levels of Bullishness
Countering some of the above sentiment concerns, there is a record amount of cash sitting in money market funds. Money market fund assets now total almost $6 trillion, up from $4.73 trillion at the end of 2022, and have accelerated rapidly in recent months.
That is a lot of dry powder to potentially come off the sidelines. We certainly don’t expect it all to flow into the market, but around the margin, there is a lot of cash to deploy should investors continue to have FOMO—fear of missing out. In addition, the large amount of cash on the sidelines could help keep corrections in check.
Market Breadth Expands
There have been several signs that market participation is broadening out, which is a welcome sign given the level of concentration in recent years. We have had several breadth thrusts during the recent surge, which historically have a good track record of signaling further gains. One such measure is the deGraaf Breadth Thrust, which measures the percent of stocks making new 20-day highs. A bullish signal is given when 55% or more of S&P 500 names make new 20-day highs. Recently, 71% of S&P 500 names made new 20-day highs. That’s only the 7th time that’s happened since 1979 and none of those previous examples produced negative returns one year out. In fact, the average return is over 20%, which would imply a 5800 price target for the S&P 500.
Other indicators are also suggesting that breadth concerns are starting to moderate. Breadth thrusts when the 5-day average of advances to declines is 2.5% or greater have recently triggered. The average gain one year later for the S&P 500 was 20%, with a positive return 95% of the time since 1950.
While we believe the market is overbought and investor sentiment is a bit too optimistic to start the year, these long-term breadth signals suggests that any pullback that relieves the short-term excesses would set the stage for another bull market up leg in 2024.
Valuations and Earnings Growth May Present Opportunities
Turning to valuations, the market is not cheap. As shown in Figure 8, the S&P 500 P/E ranks in the 81st percentile of all periods since 2010 and is nearly three points higher than this same time last year. Looking to the year ahead, based on analyst forecasts, the S&P 500 is currently trading at 19.3 times 2024 estimates, which puts it in the 45th percentile of periods since 2010.
Figure 8: P/E Ratios Up from Last Year
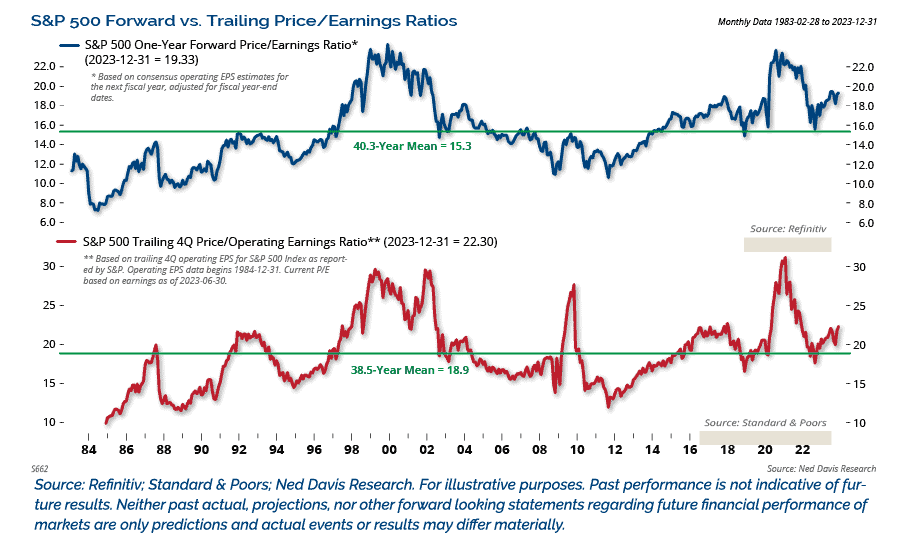
While the market may be expensive, it’s primarily a large-cap phenomenon. Large-caps are generally more expensive than small-caps, but even within the S&P 500, there are wide disparities in valuations. For example, the ten largest stocks in the S&P 500 have a median price-to-earnings (P/E) ratio of 26.9. The other 490 stocks in the index have a median P/E ratio of just 17.4. Meanwhile, stocks in the mid-cap S&P 400 trade at a median of 15.7 earnings while the median multiple of stocks in the small-cap S&P 600 trade for just 14.7 earnings. These valuations are a reason we see opportunities beyond just the large-cap stocks.
Many analysts argue that given the rate regime we currently have, multiples should be lower. Ironically, dating back to 1937, the highest P/Es were observed during periods when the 10-year Treasury yield ranged between 3% and 6%. In fact, 52% of instances where P/Es reached 18 or higher coincided with yields within the 3% to 6% range, mirroring the present day scenario. Historical data, based on yields, implies that the market may be reasonably priced.
The earnings recession that just ended was very mild, with three back-to-back quarters of modest single-digit percentage declines on a year-over-year basis. There was no revenue recession. The earnings weakness was almost entirely attributable to the decline in the profit margin due to cost-push inflation, and productivity was down due to high turnover in the labor market, with record-high quits and job openings earlier in the year.
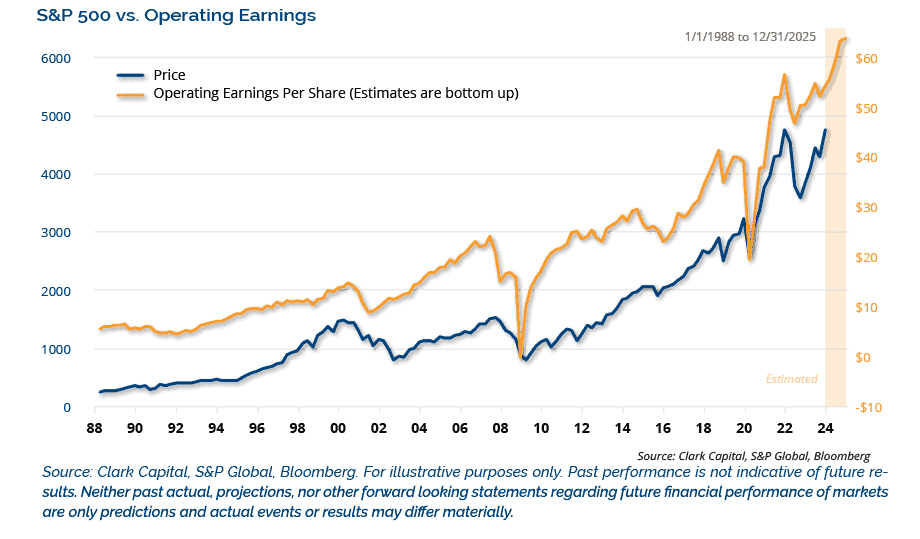
As shown in Figure 9, the earnings recession ended and S&P 500 operating earnings per share rebounded to a record high in Q3. Forward earnings also rose to a record high. We see earnings growth continuing in 2024 and 2025. Estimates for 2024 point to about $240 per share, or 11% earnings growth. We see 2025 earnings potential of $265 per share for the S&P 500. The earnings cycle should be driven by easing financial conditions, CapEx spending, a weaker U.S. dollar, and productivity gains.
Figure 9: Operating Earnings Per Share Rebounded to a Record High
The movement in stock prices can be broken down into three parts: expected and actual corporate earnings, the risk free rate, and the equity risk premium. The rise in the market over the last couple of months has been driven by the decline in interest rates. Looking ahead, we expect the pace of price appreciation to slow. However, we expect earnings to be more of a driver for stock prices going forward than they were last year. If forward earnings reach $265 by the end of next year, our 5300 target on the S&P 500 implies a forward P/E multiple of 20x.
A factor supporting earnings growth is an improvement in Manufacturing Purchasing Managers’ Index (PMIs). The ISM Manufacturing Index has been in contraction territory for 13 consecutive months; however, it is trying to stabilize. The index rose in December to a three-month high. The ISM Index bottoming is important as Manufacturing PMIs and earnings growth are positively correlated.
Historically, rising PMIs have been associated with a profits cycle, and vice versa. Given our expectations of earnings growth over the next several years, an improving manufacturing sector would confirm those expectations.
Credit Markets Suggest a Positive Backdrop for Corporate Debt
Turning to credit, spreads are often an early warning indicator of trouble in the economy, and they tend to rise consistently during equity bear markets. The current backdrop looks very much the opposite of a rising credit spread environment as spreads collapsed into the end of the year. We’ve seen one of the largest two-month declines in yields for lower rated debt on record. The yield on the High Yield Index peaked at 9.5% in October and fell to 7.5% in December. The only other times in recent history that yields have fallen faster in such a short period was after the Global Financial Crisis and during the COVID declines. Both events signaled the beginning of economic expansions and were good times to buy risk assets.
At present, high yield and investment grade bonds are performing well and show few signs of stress. Although valuations are rich, most refinancings are still a way off with a debt wall in 2025. As long as the economy remains resilient, corporate debt has the potential to post high single digit returns in 2024 on a total return basis.
Tracking the Pace and Timing of Future Rate Cuts
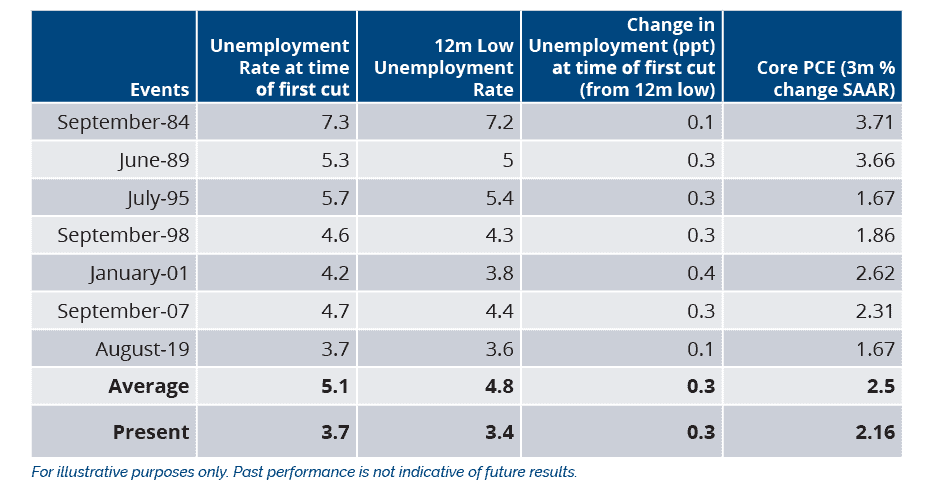
Turning to the Fed, we believe they have all the ammunition needed to start cutting rates as inflation has come down faster than they expected. The chart in Figure 10 shows where key economic data was at the start of the last 7 rate cut cycles compared to today. The most telling part is that in the past, the Fed began cutting rates when the unemployment rate had risen an average of 0.3% from its low, mirroring our current situation. Additionally, the 3-month change in Core PCE stood at 2.5% during past instances, and it currently stands at 2.2%, underscoring a potential rationale for the Fed to consider rate adjustments.
Figure 10: Where Are Things at Time of First Cut?
Our sense is that rate cuts are likely to be frontloaded as inflation is likely to continue moderating in the months ahead. The Fed may not want to appear politically motivated by altering policy too close to the election in November. The Fed left rates unchanged for the third consecutive FOMC meeting and signaled that rate hikes are finished, priming the market for rate cuts. The Fed’s most recent statement was updated to acknowledge that growth has “slowed” from the strong pace of Q3 GDP, and the characterization of inflation was updated to recognize that inflation has “eased over the past year,” but still “remains elevated.”
The median dot in their Summary of Economic Projections (SEP) showed 75 basis points (bps) of cuts in 2024, 100 bps in 2025, and 75 bps in 2026 for a cumulative 250 bps of cuts between 2024-2026. The Fed also expects core inflation to come in at 2.4% next year, GDP growth of 1.4%, and the unemployment rate to rise modestly rise to 4.1%.
Historically, the first rate cut happens an average of 7 months after the last rate hike. That would place the first rate cut in Q1. The futures market sees the Fed cutting rates six times in 2024. In our opinion, the data doesn’t justify that sort of move. We believe the Fed will cut rates to recalibrate monetary policy due to slower inflation, and not because economic activity is collapsing. We see full year economic growth of 2.25% along with 4 rate cuts as the Fed recalibrates monetary policy, with the first cut happening in March.
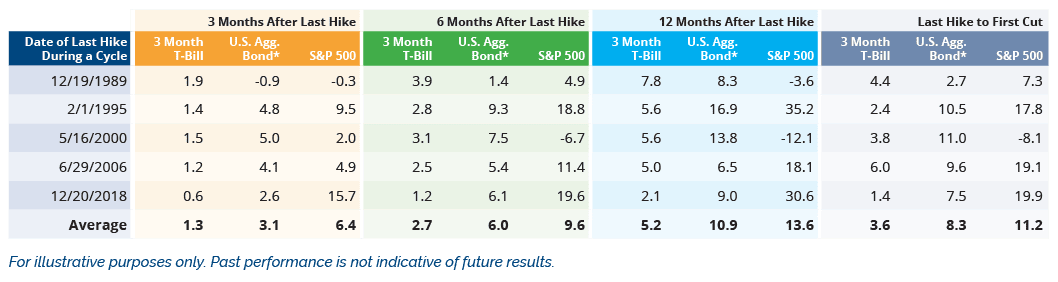
Historically, both the stock and bond markets performed well in the months after the last rate hike. As shown in Figure 11, the last 5 rate hike cycles, the S&P 500 gained an average of 11.2% into the first rate cut and 13.6% for the 12 months after the last hike. The last rate hike this cycle occurred on July 26th. If history repeats itself, that projects to about 5100 on the S&P 500 into the first rate cut and 5200 by the end of July. Given where we are in the cycle, we think the market has a tailwind for further gains.
Figure 11: What Has Historically Happened When the Fed is Done?
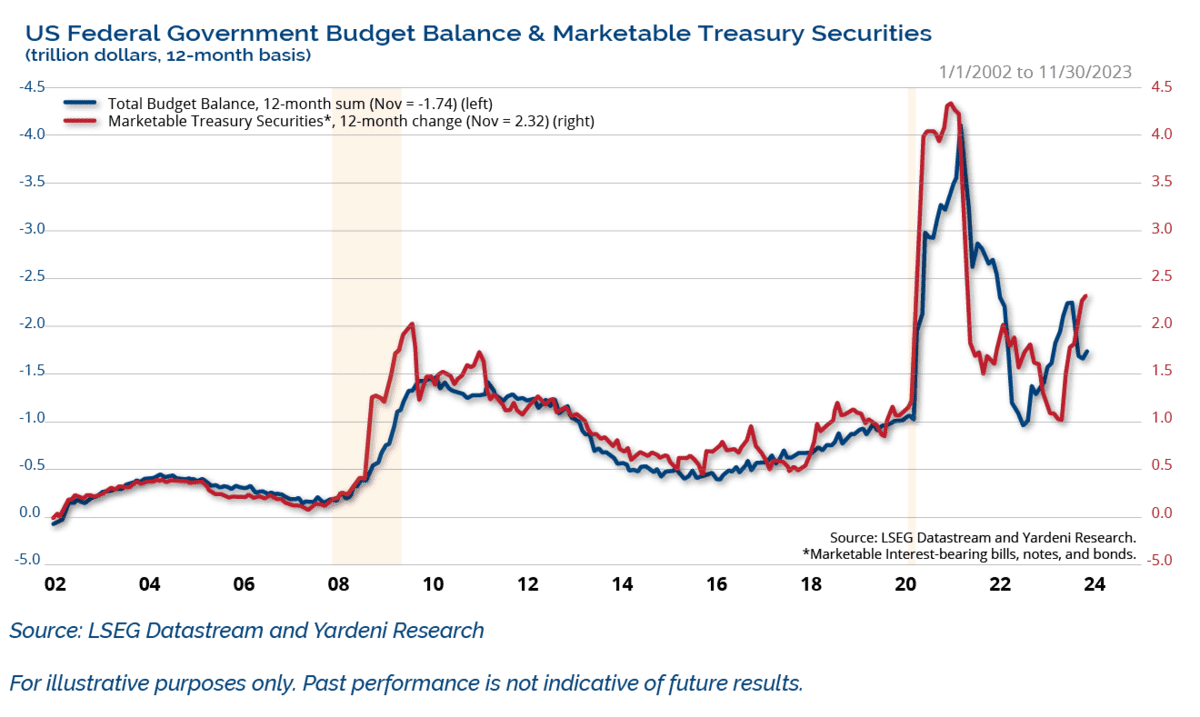
One market risk we have highlighted in the past and will continue to shine a spotlight on is the fiscal position of the U.S. government. As shown in the chart in Figure 12, over the past 12 months through November, the federal budget deficit totaled $1.74 trillion. Over the same period, the U.S. Treasury borrowed $2.32 trillion. In addition, U.S. debt is 120% of GDP, or 1.7 standard deviations more than the average of other AAA rated countries. With the presidential election looming large this year, it doesn’t appear as if any of the candidates have any real interest in reining in the debt and deficits during their terms in office.
Figure 12: U.S. Deficit Continues to Grow
Turning to the Fed, they don’t want to see inflation expectations elevated to unsustainable levels. Market-based inflation expectations continue to be anchored with 5, 7, 10, and 30-year inflation breakeven rates hovering around 2%.
Due to an unbridled fiscal policy, interest payments have surged, and are now about $1 trillion per year and are rising fast. Corporate America did a good job of taking advantage of the low rates during the pandemic by refinancing and extending maturities. In contrast, the federal government did the exact opposite by borrowing short-term. Interest rates have risen since, therefore ensuring higher interest payments on refinanced debt moving forward.
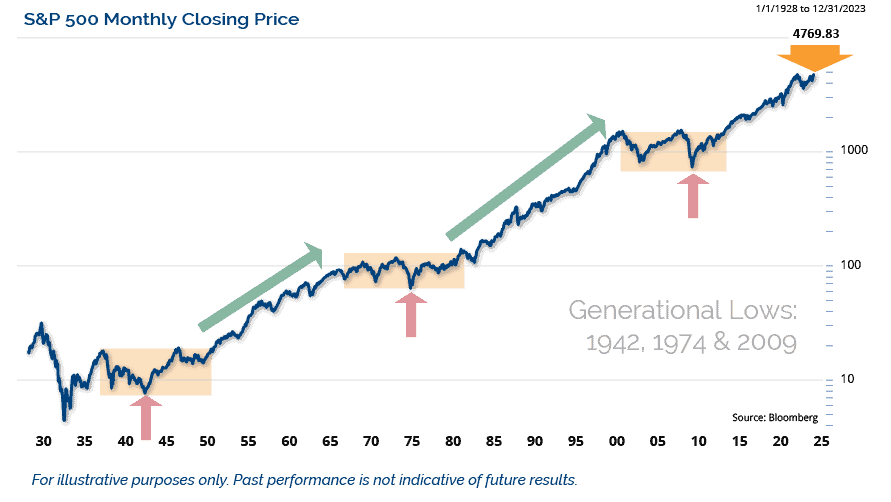
For those who have tuned into our Market Outlooks in the past, Figure 13 should be a familiar chart showing the long-term trend of the market. We have used this chart consistently to close out prior Market Outlooks. Since the Global Financial Crisis ended, the markets have been in a secular bull market. We believe that the long-term bull market is still intact, but is likely getting long in the tooth.
Figure 13: Secular Bull Market Remains Intact
Conclusion
In conclusion, as we enter 2024, we are cautiously optimistic on the economy and the markets and see potential for continued gains. While the recession vs. soft landing debate continues, evidence including solid labor market conditions, economic momentum, a more dovish Fed, and decelerating inflation suggests continued growth. As a result, we expect the economy to grow by 2.25% in 2024. We also expect the Fed to cut rates approximately 4 times as inflation is on a glidepath lower towards 2%. We see the potential for 4 rate cuts as the Fed recalibrates monetary policy.
Presidential election year trends suggest a positive year for the market. There are signs of broadening participation; small cap stocks look attractive relative to large caps. Our target for the S&P 500 based on election year trends, continued earnings growth, and some modest multiple expansion is 5300.
Every year there are risks to the Outlook and this year is no exception. Those risks include a hard economic landing, the U.S. Presidential Election if a clear winner is not decided on Election Day, geopolitics (Russia/Ukraine, Middle East, China/Taiwan), and the tenuous U.S. government fiscal position.
Eager for More Insights? Visit our 2024 Market Outlook Resource Center.
The opinions expressed are those of Clark Capital Management Group. The opinions referenced are as of the date of publication and are subject to change due to changes in the market or economic conditions and may not necessarily come to pass. There is no guarantee of the future performance of any Clark Capital investment portfolio. Material presented has been derived from sources considered to be reliable, but the accuracy and completeness cannot be guaranteed. Nothing herein should be construed as a solicitation, recommendation or an offer to buy, sell or hold any securities, other investments or to adopt any investment strategy or strategies. For educational use only. This information is not intended to serve as investment advice. This material is not intended to be relied upon as a forecast or research. The investment or strategy discussed may not be suitable for all investors. Investors must make their own decisions based on their specific investment objectives and financial circumstances. Past performance does not guarantee future results.
This document may contain certain information that constitutes forward-looking statements which can be identified by the use of forward-looking terminology such as “may,” “expect,” “will,” “hope,” “forecast,” “intend,” “target,” “believe,” and/or comparable terminology (or the negative thereof). No assurance, representation, or warranty is made by any person that any of Clark Capital’s assumptions, expectations, objectives, and/or goals will be achieved. Nothing contained in this document may be relied upon as a guarantee, promise, assurance, or representation as to the future.
Clark Capital Management Group, Inc. is an investment adviser registered with the U.S. Securities and Exchange. Commission Registration does not imply a certain level of skill or training. More information about Clark Capital’s advisory services can be found in its Form ADV which is available upon request.
The Barclays U.S. Corporate High-Yield Index covers the USD-denominated, non-investment grade, fixed-rate, taxable corporate bond market. Securities are classified as high-yield if the middle rating of Moody’s, Fitch, and S&P is Ba1/BB+/BB+ or below.
Index returns include the reinvestment of income and dividends. The returns for these unmanaged indexes do not include any transaction costs, management fees or other costs. It is not possible to make an investment directly in any index.
Fixed income securities are subject to certain risks including, but not limited to: interest rate (changes in interest rates may cause a decline in market value or an investment), credit, prepayment, call (some bonds allow the issuer to call a bond for redemption before it matures), and extension (principal repayments may not occur as quickly as anticipated, causing the expected maturity of a security to increase).
Non-investment-grade debt securities (high-yield/junk bonds) may be subject to greater market fluctuations, risk of default or loss of income and principal than higher-rated securities
The S&P 500 measures the performance of the 500 leading companies in leading industries of the U.S. economy, capturing 75% of U.S. equities.
The Russell 1000 Value Index measures the performance of the large-cap value segment of the U.S. equity universe. It includes those Russell 1000 companies with lower price-to-book ratios and lower expected growth values.
The Russell 1000 Growth Index measures the performance of the large-cap growth segment of the U.S. equity universe. It includes those Russell 1000 Index companies with higher price-to-book ratios and higher forecasted growth values.
The Russell 1000 Index measures the performance of the large-cap segment of the U.S. equity universe. It is a subset of the Russell 3000® Index and includes approximately 1000 of the largest securities based on a combination of their market cap and current index membership. The Russell 1000 represents approximately 92% of the U.S. market.
The Russell 2000 Index measures the performance of the 2000 smallest U.S. companies based on total market capitalization in the Russell 3000, which represents approximately 10% of Russell 3000 total market capitalization.
The Russell 3000 Index measures the performance of the 3000 largest U.S. companies based on total market capitalization, which represents approximately 98% of the investable U.S. equity market.
The MSCI Emerging Markets Index is a free float-adjusted market capitalization index that is designed to measure equity market performance of emerging markets. The MSCI Emerging Markets Index consists of the following 21 emerging market country indices: Brazil, Chile, China, Colombia, Czech Republic, Egypt, Hungary, India, Indonesia, Korea, Malaysia, Mexico, Morocco, Peru, Philippines, Poland, Russia, South Africa, Taiwan, Thailand, and Turkey.
The MSCI World ex US Index is a market capitalization-weighted index designed to measure equity performance in 22 global developed markets, excluding the United States. The benchmark for this composite is used because the MSCI World Ex US Net Index is generally representative of international equities.
BBgBarc U.S. Aggregate Bond Index covers the U.S. investment-grade fixed-rate bond market, including government and credit securities, agency mortgage pass-through securities, asset-backed securities and commercial mortgage-based securities. To qualify for inclusion, a bond or security must have at least one year to final maturity, and be rated investment grade Baa3 or better, dollar denominated, non-convertible, fixed rate and publicly issued.
The BBgBarc US Treasury Index measures US dollar-denominated, fixed-rate, nominal debt issued by the US Treasury. Treasury bills are excluded by the maturity constraint but are part of a separate Short Treasury Index. STRIPS are excluded from the index because their inclusion would result in double-counting. The US Treasury Index is a component of the US Aggregate, US Universal, Global Aggregate and Global Treasury Indices.
The BBgBarc US Corporate Bond Index measures the investment grade, fixed-rate, taxable corporate bond market. It includes USD-denominated securities publicly issued by US and non-US industrial, utility and financial issuers. The US Corporate Index is a component of the US Credit and US Aggregate Indices, and provided the necessary inclusion rules are met, US Corporate Index securities also contribute to the multi-currency Global Aggregate Index.
The BBgBarc U.S. Corporate High-Yield Index covers the U.S. dollar-denominated, non-investment grade, fixed-rate, taxable corporate bond market. Securities are classified as high-yield if the middle rating of Moody’s, Fitch, and S&P is Ba1/BB+/BB+ or below.
The BBgBarc U.S. Municipal Index covers the USD-denominated long-term tax-exempt bond market. The index has four main sectors: state and local general obligation bonds, revenue bonds, insured bonds and prerefunded bonds.
The Global Manufacturing PMI™ indices are all seasonally adjusted. The seasonal adjustment is applied at the national level (as opposed to at the global aggregate level) in order to account for differing seasonal patterns in each of the nations included. Global Manufacturing PMI™ indices are weighted according to national contributions to global manufacturing gross value added. Weights for the global indices are derived from the latest available World Bank data on the gross value added of manufacturing for each of the nations covered. World Bank data on value added are in constant 2010 US$, with all national currencies converted to 2010 US$ by the World Bank using DEC alternative conversion factors.
The NDR Credit Conditions Indices (CCI) are designed to objectively measure credit conditions in the U.S. market, specifically the cost & availability of credit. The index consists of two equal-weighted components and historically evaluates business and consumer credit conditions.
NDR (Ned Daily Research) Daily Trading Sentiment Index is based on the S&P 500 Daily Sentiment Index which shows a short-term sentiment view of the S&P 500 Index
Created by the Chicago Board Options Exchange (CBOE), the Volatility Index, or VIX, is a real-time market index that represents the market’s expectation of 30-day forward-looking volatility. Derived from the price inputs of the S&P 500 index options, it provides a measure of market risk and investors’ sentiments.
The 10-year Treasury note is a debt obligation issued by the United States government with a maturity of 10 years upon initial issuance. A 10-year Treasury note pays interest at a fixed rate once every six months and pays the face value to the holder at maturity.
The Dow Jones Industrial Average is the most widely used indicator of the overall condition of the stock market, a price-weighted average of 30 actively traded blue chip stocks, primarily industrials. The 30 stocks are chosen by the editors of the Wall Street Journal (which is published by Dow Jones & Company), a practice that dates back to the beginning of the century. The Dow is computed using a price-weighted indexing system, rather than the more common market cap-weighted indexing system.
Index returns include the reinvestment of income and dividends. The returns for these unmanaged indexes do not include any transaction costs, management fees or other costs. It is not possible to make an investment directly in any index.
The volatility (beta) of an account may be greater or less than its respective benchmark.
The Consumer Price Index (CPI) measures the change in prices paid by consumers for goods and services. The CPI reflects spending patterns for each of two population groups: all urban consumers and urban wage earners and clerical workers. CCM-672
![]()
