
Riding the Waves
Highlights
We believe:
- Our annual forecast for the S&P 500 was 5300. We are increasing that target to 5800 and expect the 10-year Treasury yield to end in the 3.25%-4.5% range.
- History suggests a pause/correction heading into the election; however, presidential election year trends are still a positive factor for the market.
- We do not foresee a recession, but we do anticipate slower economic growth and expect 2.25% GDP in 2024.
- The Fed is done hiking rates with cuts forthcoming. Market expectations have shifted from 6 cuts at the beginning of the year to 2 cuts.
- Inflation continues to cool towards the 2% zone. Excluding housing, inflation is already in the 2% range.
- We believe valuations remain “fair” for stocks with strong earnings growth. Small and mid-cap stocks appear cheap compared to large-caps.
- Risks remain elevated and include the U.S. presidential election, geopolitics (Russia/Ukraine, Middle East, China/Taiwan), and the U.S. government fiscal position.
Looking Back
Coming into the year, we were bullish on the market: we expected rate cuts to be forthcoming, inflation to continue its path towards the Fed’s 2% target, and expected continued economic growth. Now, halfway through the year, most of these expectations remain unchanged. However, we are increasing our target for the S&P 500.
While we had one of the most bullish targets for the market, it has exceeded our expectations… kind of. The S&P 500 is beyond our year-end target, but our call for a choppy advance in the first half of the year is consistent with what has occurred under the surface. As for the S&P 500, we are increasing our target to 5800 based on increasing forward earnings estimates, continued economic growth, and the likelihood of rate cuts and lower yields in the second half of the year.
Economic growth remains firm, but slower than last year. First half GDP growth will be in the 1.8% range, tracking just behind our 2.25% target for the year.
The major factors influencing the markets during the first half of the year were:
- Strong momentum, which helped the market power higher despite higher interest rates.
- Strong earnings growth for large-cap companies with record reported earnings and forward earnings expectations.
- Re-pricing of the number of rate cuts expected. Coming into the year, the market was expecting 6-7 rate cuts and now only 2 rate cuts are priced into expectations.
Last year confounded many as the economy remained resilient even as the Fed continued to hike overnight rates into the middle of the year. Inflation came down, and stocks soared. The trend continued once it became clear that the Fed was done hiking rates. Market participation briefly broadened out, but once again, has become concentrated in large-cap stocks.
As shown in Figure 1, equity markets have enjoyed strong, but very mixed gains year to date, led by large-cap U.S. indices.
Figure 1. Perspective
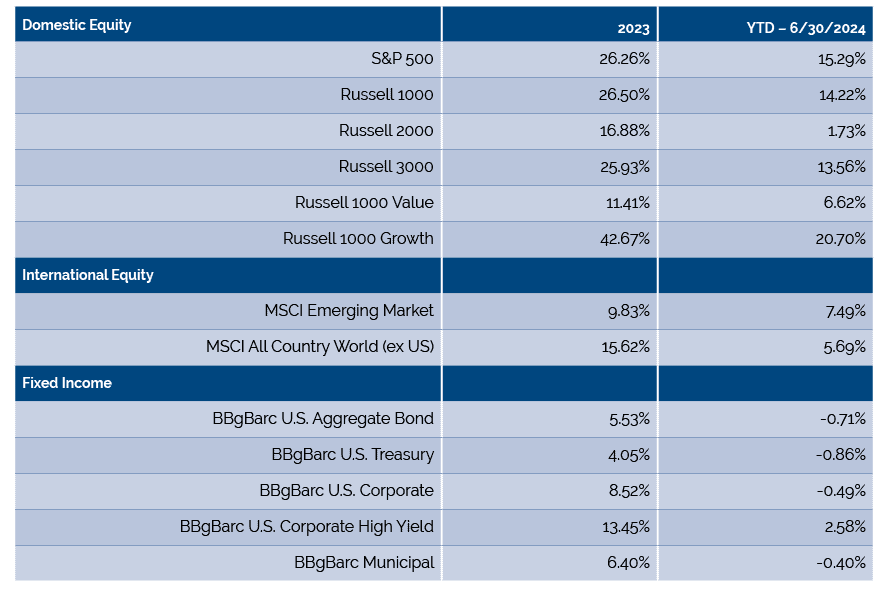
The S&P 500 gained 15.29%, the Russell 2000 Index of small-cap stocks gained only 1.73%, and international stocks gained 5.69%. Large-cap growth has led all styles, with a sharp focus on Technology stocks and high cash flow margin companies outpacing all others.
Fixed income returns were also mixed with credit enjoying gains and duration largely flat after suffering losses early in the year as rates advanced and the yield curve shifted higher. The Bloomberg Barclays U.S. Corporate High Yield Index gained 2.58%, while the Aggregate Bond Index was down 0.71%, and the U.S. Treasury Index declined by 0.86%. Rates moved higher as Fed officials squashed immediate rate cut expectations.
However, gains have not all come in a straight line higher, and there were significant differences between stocks of different markets capitalizations. While the S&P 500 Index is trading in new high territory, the same index on an equal-weighted basis has lagged. Small-cap stocks peaked on 11/8/2021 and are still 12.90% below that high. Meanwhile, the cumulative advance-decline line is also lagging. These divergences deserve to be monitored and indicate that risks of a correction may be elevated if they persist.
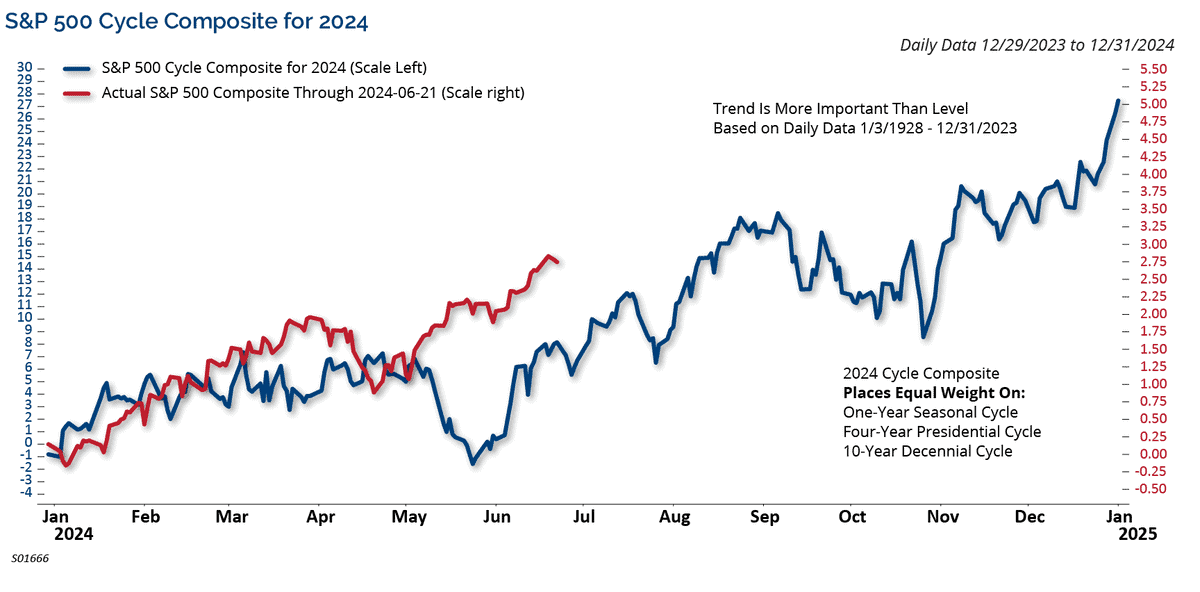
The Ned Davis Research Cycle Composite combines the one-year cycle, four-year cycle (election years), and decennial cycle into a single composite. The blue line is the Composite, and the red line is the S&P 500. It suggested a higher but choppy market early in the year, a strong summer rally, volatility ahead of the presential election, and a strong year-end rally. That playbook is very consistent with the normal presidential election year trends.
To date, the market, or at least the S&P 500, has been a lot stronger than the composite suggested. Figure 2 shows an additional period of summer seasonal strength before an early autumn pause. That coincides with the potential for volatility near the November election.
Figure 2: Cycle Composite Suggests Seasonal Strength Before a Pause
In our January Market Outlook, we highlighted a positive technical indicator called the deGraaf Breadth Thrust. It happens when at least 55% of the S&P 500 names make new 20-day highs. On December 14th, 71% of S&P 500 names made new 20-day highs.
Since then, the S&P 500 has played out according to the script:
- The average 3-month prediction for the market was 9%. The actual 3-month return from 12/14/23 was 9.1%.
- The average 6-month predicted return was 14%. The actual return was 14.8%.
- The average 12-month return is 22%, which would put the S&P at 5,757 by 12/14/24.
This suggests the market has upside potential in the second half of the year, which is also consistent with election year trends and the Cycle Composite.
On Course for a Soft Landing?
Shifting gears, the economy has been strong, fueled by labor market gains, seven consecutive quarters of GDP growth, easing inflation, and record highs in corporate earnings.
There is an almost universal belief that the U.S. economy is on course for a soft landing. The two most compelling arguments fueling that belief are easing inflation and a persistently strong labor market.
We now have a massive $28 trillion a year economy. The economy averaged 3.1% growth in 2023, which was much stronger than many talking heads expected. However, the economy is now slowing. In the first quarter of this year, the economy expanded 1.4%. Second quarter growth, according to the Atlanta Fed’s GDPNow model, is expected to come in around 2.25%. If that holds, first half growth likely works out to be in the neighborhood 1.8%. The economy is still growing, but at a slower pace. Ultimately, employment follows economic growth. If growth is slowing, then we would expect employment to soften as well.
In our past two annual Market Outlooks we said, “until meaningful weakness is revealed in the labor market, calls for recession seem premature.” Now, while we still don’t see signs of a recession, there are warning signs coming from the labor markets.
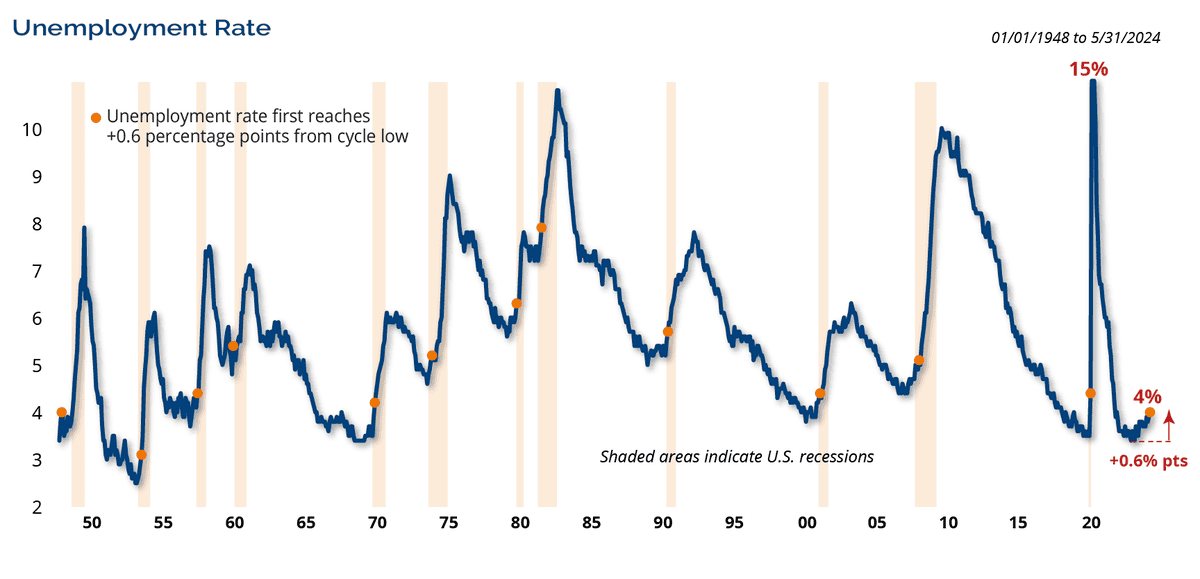
The unemployment rate has never been considered a leading indicator for the U.S. economy, but it does signal when the economy is starting to slow. As shown in Figure 3, the unemployment rate has climbed 0.6% from its low point in April 2023 to 4%.
Figure 3: Labor Market Conditions Cooling
For illustrative purposes only. Past performance is not indicative of future results.
The rise in unemployment has coincided with plenty of evidence that labor market conditions have cooled. Job openings have declined while the hires and quits rate is lower today than it was at the onset of the pandemic. Additionally, continuing jobless claims rose to their highest level since the end of 2021. The 4% unemployment rate is also already at the Fed’s year-end target stated in their latest Summary of Economic Projections (SEP).
The rate has risen 0.6% off its cycle low, which is an occurrence that has preceded every recession in the post-WWII era. Count us among those that think the Fed should act soon to recalibrate monetary policy.
Inflation was a primary driver of the surge in yields and heightened volatility in the bond market over the past couple of years. It turned out to be mostly attributable to the shocks and aftershocks of the pandemic, which have been dissipating.
Inflation is a lagging indicator; today’s softer inflation data represents yesterday’s monetary policy. By keeping rates elevated, the Fed is now passively tightening policy by doing nothing.
As shown in Figure 4, inflation continues to moderate. The Consumer Price Index (CPI) hit 3.3% year over year while the Producer Price Index (PPI) has risen just 2.2% year over year, down from peaks of 9.1% and 11.1%, respectively. Inflation did tick higher to start the year, but we never expected it to come down in a straight line. Meanwhile, the Fed’s preferred inflation gauge, Core PCE, has moderated to 2.6% year over year, its lowest reading in over 3 years. This reading should give the Fed further comfort that the inflation trajectory continues to cool.
Figure 4: Inflation Continues to Moderate

For illustrative purposes only. Past performance is not indicative of future results.
The two areas that have been holding up inflation are auto insurance and shelter, both of which have begun to soften. In fact, Core CPI ex-shelter has already fallen into the Fed’s target zone and is at 1.9% year over year.
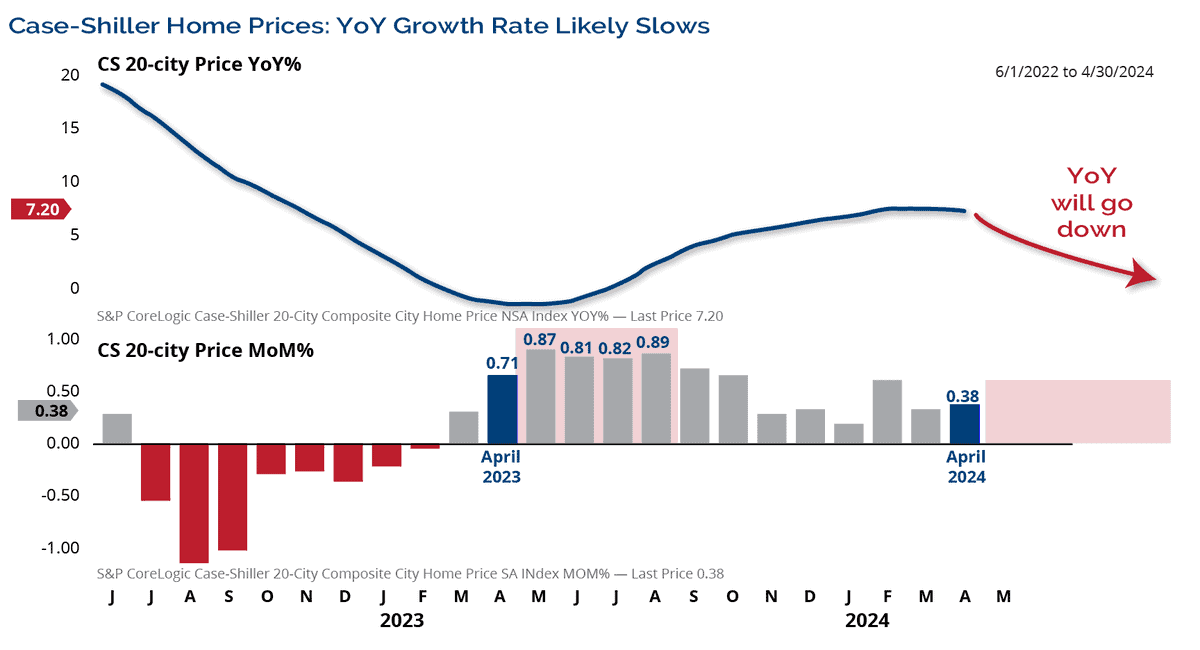
Housing prices, shown in Figure 5 by the Case Shiller Index, have a delayed impact on headline inflation figures. Home price inflation is expected to moderate over the next few months, as the large monthly increases from last year phase out, causing year-over-year figures to decline. The Case Shiller Home Price Index leads CPI Owners’ Equivalent Rent by about 17 months. The lower monthly data points over the next several months imply that the shelter component of CPI is also set to roll over. The Fed has been waiting for housing to catch up and this now appears to be falling into place.
Figure 5: Housing Playing Catchup
For illustrative purposes only. Past performance is not indicative of future results.
Austan Goolsbee, head of the Chicago Fed, confirmed this recently on CNBC. He said, “Market rents normally come into the actual inflation series with a bit of a lag and that lag has been longer than what we thought it should be… we will start to see in the official statistics, the reflection of what’s happened in the market rents data… where the inflation rate has come down pretty significantly.”
Changing Rate Cut Expectations
Coming into the year, the market was expecting 6-7 rate cuts, and we anticipated 3 rate cuts. Fast forward to today, and the fed funds futures market now expects the Fed to cut rates twice this year. So, the market has aligned with our initial expectations.
The Fed has four more FOMC meetings left this year. There is an outside chance of a July policy move. However, given that the annual Jackson Hole Economic Policy Symposium takes place in August, and the Fed typically uses this event to shape and message future policy directions, it is more likely that the first rate cut will occur at the September FOMC meeting.
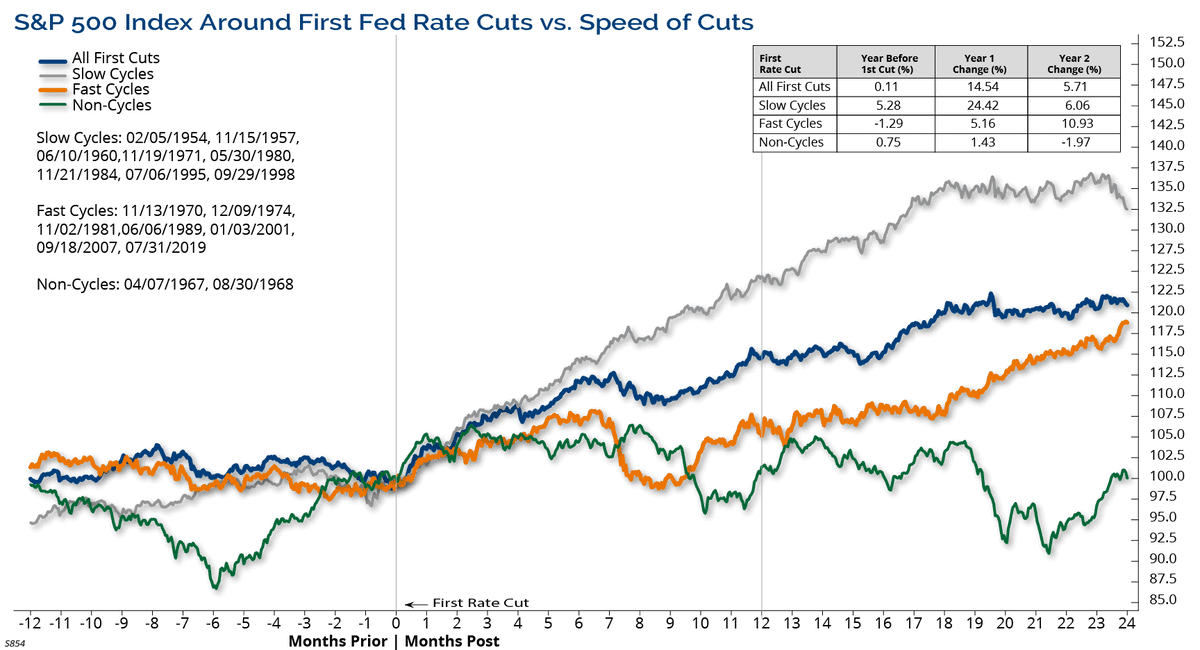
What happens to market performance after the Fed begins cutting rates? The answer is there is a difference between rate cuts at a fast pace versus a slow pace. Slow rate cut cycles can be considered a re-calibration of policy to maintain healthy economic activity. As shown in Figure 6, in slower rate cut cycles when the Fed doesn’t cut rates in successive meetings, the market has averaged a gain of 24.4% one year later.
Figure 6: Slow Cut Cycles are Better for the Markets
For illustrative purposes only. Past performance is not indicative of future results.
In fast rate cut cycles (1970s recessions, the 1990 recession, Global Financial Crisis/COVID) the wheels were falling off the economy and markets required dramatic action. Gains one year later in those cases were 5.1%.
Given our expectation of continued economic growth in addition to what the Fed has already messaged, we don’t expect a fast rate cut cycle. However, the longer the Fed stays put, the more difficult it may be to adjust monetary policy as the election draws near.
A lot has been made of the concentration in the market and small-cap underperformance. Small-cap indices have broken down to multi-year lows versus their large-cap counterparts. More than any another capitalization range, small-caps have been hurt by the delay in rate cuts due to their dependence on the capital markets for funding. Mega-caps have managed their cash flows and balance sheets to insulate themselves from the Fed.
We are closely monitoring the small-cap to large-cap ratios as the Russell 2000 has tended to outperform during the first year of easing cycles, especially when the Fed has moved slowly.
Valuations and Earnings Growth
Turning to valuations, the market is not cheap, but we wouldn’t call it excessively overvalued either. The valuation landscape is more nuanced today than it has been in recent memory. Much of the discussion we hear around high valuations are from the Elite 8 stocks, which also happen to be the primary driver of earnings growth.
Figure 7 shows the forward price to earnings (P/E) ratio for the S&P 500 (20.9), the S&P 500 minus the mega-cap Elite 8 stocks (18), and the mega-cap Elite 8 (trading at a P/E of 30.8). In general, the largest stocks are modestly overvalued, but are commanding a premium compared to the rest of the market because they are consistently driving earnings growth. It is normal for companies that deliver higher earnings growth to trade at higher valuations.
Figure 7: Forward P/E Ratios

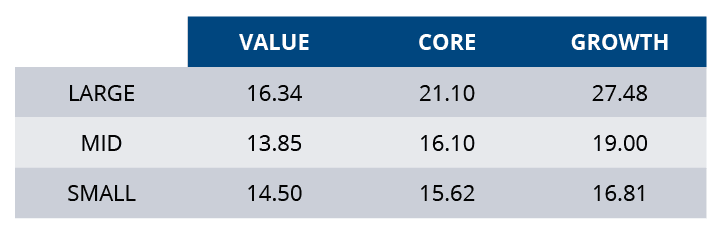
Figure 8: Valuations by Style Box Suggest the Broader Market is Fairly Valued
For illustrative purposes only. Past performance is not indicative of future results.
We believe the valuations discrepancy is primarily a large-cap phenomenon. Large-caps are generally more expensive than lesser caps. For example, small-cap core stocks trade at a 26% discount to large-cap core, and large-cap value trades at a 40% discount to large-cap growth.
For many years, large-cap growth/Technology companies dominated, and their valuations reflect that. We believe that opportunities exist elsewhere, and a broadening of performance would be healthy for the market.
We can’t talk about valuations without mentioning earnings. After all, the price of a stock is what we are willing to pay for the company’s future earnings stream. Over time, stock prices and earnings growth are highly correlated.
As shown in Figure 9, earnings and future expected earnings are both out to new all-time highs. That bodes well for the market in the coming quarters. In January’s Market Outlook we said, “The rise in the stock market over the last couple months has been driven by the decline in interest rates. Looking ahead, we expect the pace of price appreciation to slow. However, we expect earnings to be more of a driver for stock prices going forward then they were last year.”
Figure 9: Earnings Expectations Moving Sharply Higher

For illustrative purposes only. Projections or other forward looking statements regarding future financial performance of markets are only predictions.
Earnings expectations are moving sharply higher, with sequentially higher earnings expected. Barring an unforeseen economic upset, corporate earnings should underpin stocks and allow for additional price gains.
Coming into the year, 2025 earnings estimates were $265 per share for the S&P 500. A forward P/E multiple of 20 implied a 5300 target at year end 2024, which was also our target. Earnings growth has been strong, and estimates have continued to rise. The current forward P/E is 21 and with earnings estimates of $276, that now implies a year-end target of 5800.
Investor Sentiment Takes a Turn
Investor sentiment plays a large role in the intermediate-term trends of the market. We believe sentiment is a very good contrarian indicator—when investors are bullish, the market is at risk of a correction. On the flipside, when investors are bearish and worried, the market is usually at a point where it will turn higher.
In 2023, the S&P 500 gained 26.3%, yet most investors sat on the sidelines as many expected the U.S. economy to dip into recession. Many investors remained bearish throughout 2023. At the end of last year, the American Association of Individual Investors sentiment poll reached extreme levels of bearishness not seen since pre-COVID. That set the stage for the market to continue rallying in the first half of this year.
As we moved into 2024, investor skepticism diminished as investors started to have a fear of missing out on the market gains. Investor sentiment has turned a little too optimistic. Currently, only 22.5% of individual investors say they are bearish while 44.4% are bullish. A 2:1 ratio of bulls to bears is reaching extreme levels of sentiment.
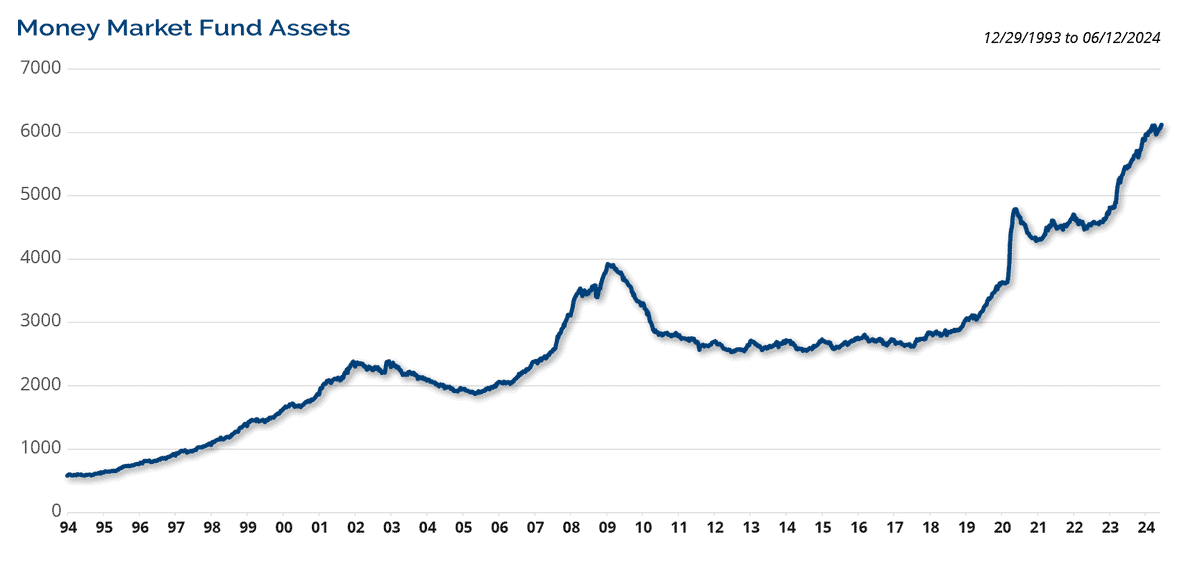
However, Figure 10 shows that there is a record amount of cash still sitting in money market funds. Money market fund assets reached a record $6.1 trillion, and have accelerated rapidly in recent months.
Figure 10: Record Amount of Cash Still Sitting on the Sidelines
For illustrative purposes only. Past performance is not indicative of future results.
That is a lot of dry powder to potentially come off the sidelines. We certainly don’t expect it all to flow into the market, but around the margin, there is a lot of cash to deploy into the market. In addition, the large amount of cash on the sidelines could help keep corrections in check.
A Historical Perspective on Election Year Trends
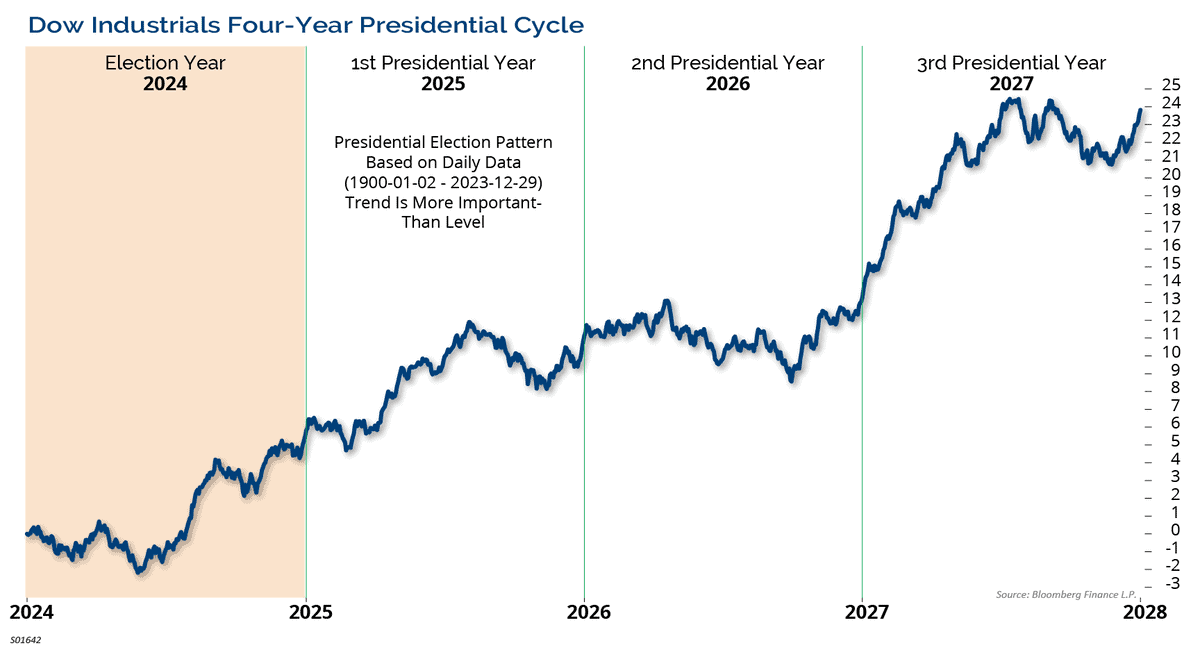
Figure 11, shows that since WWII, election years have been the second strongest of the 4-year Presidential Cycle, with a median gain of 10.7% and gains in 83% of the years. Historically, election years tend to exhibit a consistent pattern of weakness/consolidation early in the year followed by strength in the second half of the year. This year has bucked the trend and has been stronger than normal, at least for large-cap stocks.
Figure 11: The 4-Year Presidential Cycle Suggests Strong Second Half of the Year
For illustrative purposes only. Past performance is not indicative of future results.
On average, the stock market bottoms in May during election years, but the standard deviation around that is large. This year, the S&P 500 bottomed on April 19th. Given the current political discourse in the country, and the possibility of a very close race, election uncertainty could overhang in the market longer than usual.
The market has historically performed better when the incumbent party retained the White House. There is a chicken and-egg element to the analysis. A weak economy is bearish for the stock market, and the incumbent party is often blamed. This year, the economy is fine, there is no recession, and unemployment is low. However, inflation has dragged down confidence.
The current candidates are known commodities, but ironically there is a lot of uncertainty. The first presidential debate created even more uncertainty with many people in the media and top Democratic Party officials concerned about President Biden’s performance. Historically, first debates don’t normally move the needle in the polls, but political analysts are cautioning about a wide variety of potential events, including another candidate replacing President Biden on the ballot.
We believe it is going to be another close election, and the winner may not even be known on election night. We do think that is one of the biggest geopolitical risks facing the market in the near term. There is a good chance that no winner is announced on Election Day. Or worse, the loser may not concede. Both scenarios inject some risk and therefore, we expect to see a bout of volatility around the election.
As shown in Figure 12, the political party of the president hasn’t had a meaningful impact on returns. Stocks don’t see red or blue, they see green— as in company profits. Over time, the market has gone up, regardless of who controls the White House.
Figure 12: Markets Continue Upward, Despite Who’s in Control

It’s often argued that gridlock is good, but since the start of the 20th century, returns have been better when the same party has controlled the White House, Senate, and House versus periods when control was split. Historically, when Republicans controlled both houses of Congress, returns were modestly better than when Democrats controlled both chambers.
As shown in Figure 13, total outstanding U.S. government debt is at record highs and with the presidential election looming large this year, it doesn’t appear as if either of the candidates have any real interest in reining in the debt and deficits during their terms in office.
Figure 13: Outstanding U.S. Government Debt at Record Highs
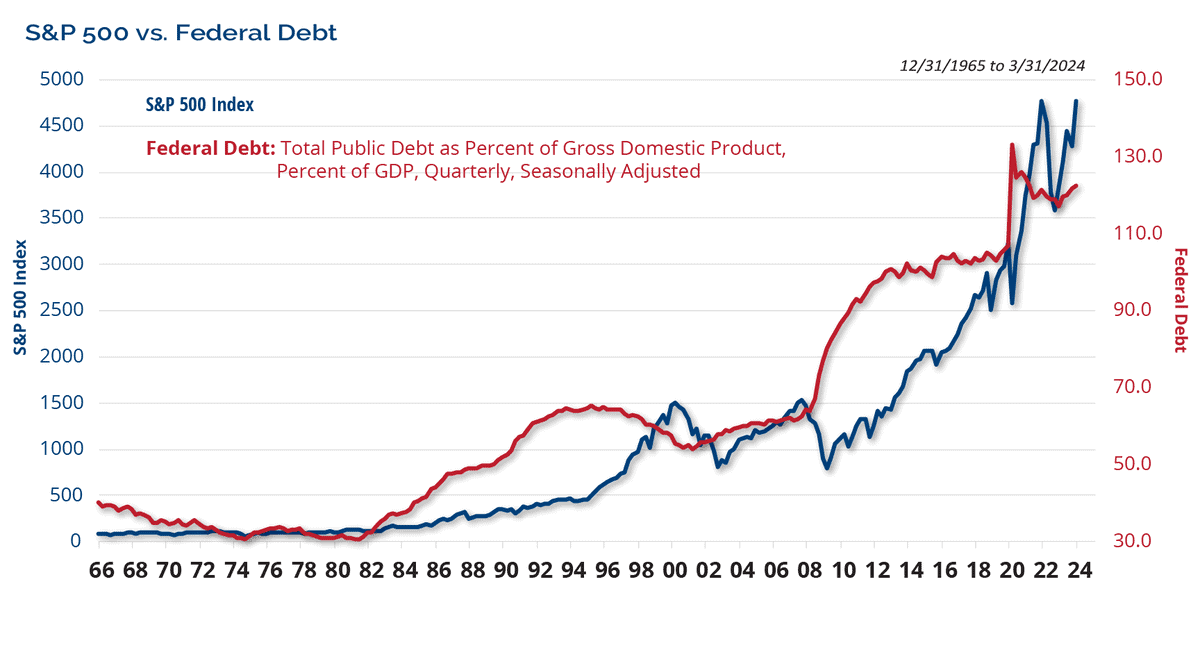
That is a major concern for investors and a common question we hear all the time is, “how will this impact the markets?” The answer might not be what people think. Eventually it will matter, but nobody knows when that Minsky moment will be. However, looking back at history, which includes almost 60-years’ worth of data, the debt-to-GDP ratio in the U.S. tripled, and went from 40% to 120%. Over the same time period, the S&P 500 went from 90 to 5000, a 55x multiple.
When the debt load matters is when the demand for our U.S. Treasury securities is less than the supply. That is a major risk every time there is a Treasury auction. So far, the demand has been there.
Conclusion
We show the chart in Figure 14 at the end of every Market Outlook. This chart shows the long-term trend of the market. Since the Global Financial Crisis ended, the markets have been in a secular bull market. We believe that long-term bull market is still intact, but likely getting long in the tooth.
Figure 14: The Secular Bull Market Remains Intact
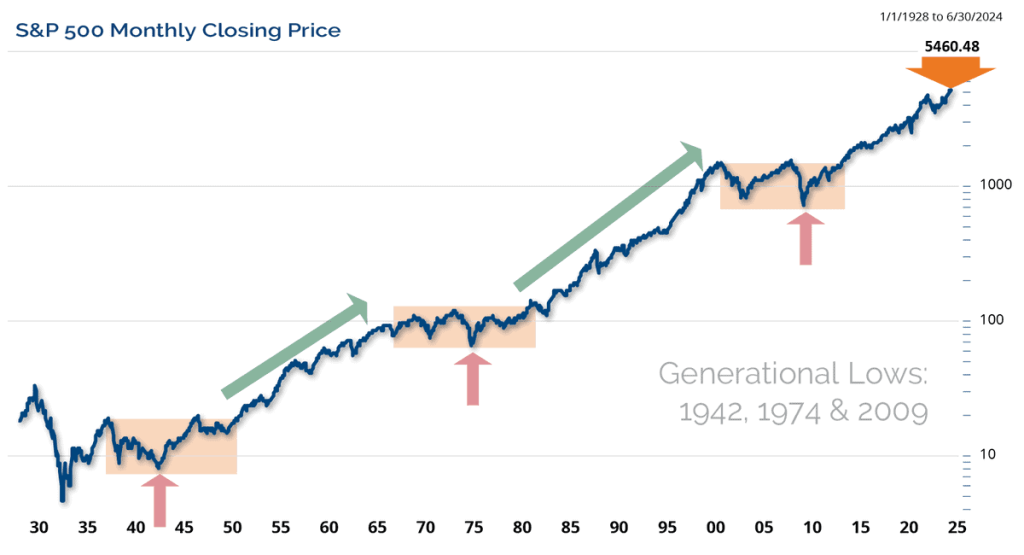
In conclusion, coming into the year, we had one of the most bullish targets for the market. So far, it has exceeded our expectations, but overall market returns have been more muted than the S&P 500. We are increasing our target for the S&P 500 to 5800 based on increasing forward earnings estimates, continued economic growth, and the likelihood of rate cuts in the second half of the year. We are also looking for market participation to broaden out.
Economic growth remains firm, but slower than last year. GDP for the first half of the year will be in the 2.2% range, tracking closely towards our 2.25% target for the year.
Every year, there are risks to the Outlook, and this year is no exception. Those risks include a hard economic landing, the U.S. presidential election, geopolitics (Russia/Ukraine, Middle East, China/Taiwan and overseas elections), and the ongoing challenge of the U.S. fiscal position and debt burden.
Looking for More Insights? Visit our 2024 Market Outlook Resource Center.
This document may contain certain information that constitutes forward-looking statements which can be identified by the use of forward-looking terminology such as “may,” “expect,” “will,” “hope,” “forecast,” “intend,” “target,” “believe,” and/or comparable terminology (or the negative thereof). No assurance, representation, or warranty is made by any person that any of Clark Capital’s assumptions, expectations, objectives, and/or goals will be achieved. Nothing contained in this document may be relied upon as a guarantee, promise, assurance, or representation as to the future.
Clark Capital Management Group, Inc. is an investment adviser registered with the U.S. Securities and Exchange. Commission Registration does not imply a certain level of skill or training. More information about Clark Capital’s advisory services can be found in its Form ADV which is available upon request.
The Barclays U.S. Corporate High-Yield Index covers the USD-denominated, non-investment grade, fixed-rate, taxable corporate bond market. Securities are classified as high-yield if the middle rating of Moody’s, Fitch, and S&P is Ba1/BB+/BB+ or below.
Index returns include the reinvestment of income and dividends. The returns for these unmanaged indexes do not include any transaction costs, management fees or other costs. It is not possible to make an investment directly in any index.
Fixed income securities are subject to certain risks including, but not limited to: interest rate (changes in interest rates may cause a decline in market value or an investment), credit, prepayment, call (some bonds allow the issuer to call a bond for redemption before it matures), and extension (principal repayments may not occur as quickly as anticipated, causing the expected maturity of a security to increase).
Non-investment-grade debt securities (high-yield/junk bonds) may be subject to greater market fluctuations, risk of default or loss of income and principal than higher-rated securities
The S&P 500 measures the performance of the 500 leading companies in leading industries of the U.S. economy, capturing 75% of U.S. equities.
The Russell 1000 Value Index measures the performance of the large-cap value segment of the U.S. equity universe. It includes those Russell 1000 companies with lower price-to-book ratios and lower expected growth values.
The Russell 1000 Growth Index measures the performance of the large-cap growth segment of the U.S. equity universe. It includes those Russell 1000 Index companies with higher price-to-book ratios and higher forecasted growth values.
The Russell 1000 Index measures the performance of the large-cap segment of the U.S. equity universe. It is a subset of the Russell 3000® Index and includes approximately 1000 of the largest securities based on a combination of their market cap and current index membership. The Russell 1000 represents approximately 92% of the U.S. market.
The Russell 2000 Index measures the performance of the 2000 smallest U.S. companies based on total market capitalization in the Russell 3000, which represents approximately 10% of Russell 3000 total market capitalization.
The Russell 3000 Index measures the performance of the 3000 largest U.S. companies based on total market capitalization, which represents approximately 98% of the investable U.S. equity market.
The MSCI Emerging Markets Index is a free float-adjusted market capitalization index that is designed to measure equity market performance of emerging markets. The MSCI Emerging Markets Index consists of the following 21 emerging market country indices: Brazil, Chile, China, Colombia, Czech Republic, Egypt, Hungary, India, Indonesia, Korea, Malaysia, Mexico, Morocco, Peru, Philippines, Poland, Russia, South Africa, Taiwan, Thailand, and Turkey.
The MSCI World ex US Index is a market capitalization-weighted index designed to measure equity performance in 22 global developed markets, excluding the United States. The benchmark for this composite is used because the MSCI World Ex US Net Index is generally representative of international equities.
BBgBarc U.S. Aggregate Bond Index covers the U.S. investment-grade fixed-rate bond market, including government and credit securities, agency mortgage pass-through securities, asset-backed securities and commercial mortgage-based securities. To qualify for inclusion, a bond or security must have at least one year to final maturity, and be rated investment grade Baa3 or better, dollar denominated, non-convertible, fixed rate and publicly issued.
The BBgBarc US Treasury Index measures US dollar-denominated, fixed-rate, nominal debt issued by the US Treasury. Treasury bills are excluded by the maturity constraint but are part of a separate Short Treasury Index. STRIPS are excluded from the index because their inclusion would result in double-counting. The US Treasury Index is a component of the US Aggregate, US Universal, Global Aggregate and Global Treasury Indices.
The BBgBarc US Corporate Bond Index measures the investment grade, fixed-rate, taxable corporate bond market. It includes USD-denominated securities publicly issued by US and non-US industrial, utility and financial issuers. The US Corporate Index is a component of the US Credit and US Aggregate Indices, and provided the necessary inclusion rules are met, US Corporate Index securities also contribute to the multi-currency Global Aggregate Index.
The BBgBarc U.S. Corporate High-Yield Index covers the U.S. dollar-denominated, non-investment grade, fixed-rate, taxable corporate bond market. Securities are classified as high-yield if the middle rating of Moody’s, Fitch, and S&P is Ba1/BB+/BB+ or below.
The BBgBarc U.S. Municipal Index covers the USD-denominated long-term tax-exempt bond market. The index has four main sectors: state and local general obligation bonds, revenue bonds, insured bonds and prerefunded bonds.
The Global Manufacturing PMI™ indices are all seasonally adjusted. The seasonal adjustment is applied at the national level (as opposed to at the global aggregate level) in order to account for differing seasonal patterns in each of the nations included. Global Manufacturing PMI™ indices are weighted according to national contributions to global manufacturing gross value added. Weights for the global indices are derived from the latest available World Bank data on the gross value added of manufacturing for each of the nations covered. World Bank data on value added are in constant 2010 US$, with all national currencies converted to 2010 US$ by the World Bank using DEC alternative conversion factors.
The NDR Credit Conditions Indices (CCI) are designed to objectively measure credit conditions in the U.S. market, specifically the cost & availability of credit. The index consists of two equal-weighted components and historically evaluates business and consumer credit conditions.
NDR (Ned Daily Research) Daily Trading Sentiment Index is based on the S&P 500 Daily Sentiment Index which shows a short-term sentiment view of the S&P 500 Index
Created by the Chicago Board Options Exchange (CBOE), the Volatility Index, or VIX, is a real-time market index that represents the market’s expectation of 30-day forward-looking volatility. Derived from the price inputs of the S&P 500 index options, it provides a measure of market risk and investors’ sentiments.
The 10-year Treasury note is a debt obligation issued by the United States government with a maturity of 10 years upon initial issuance. A 10-year Treasury note pays interest at a fixed rate once every six months and pays the face value to the holder at maturity.
The Dow Jones Industrial Average is the most widely used indicator of the overall condition of the stock market, a price-weighted average of 30 actively traded blue chip stocks, primarily industrials. The 30 stocks are chosen by the editors of the Wall Street Journal (which is published by Dow Jones & Company), a practice that dates back to the beginning of the century. The Dow is computed using a price-weighted indexing system, rather than the more common market cap-weighted indexing system.
Index returns include the reinvestment of income and dividends. The returns for these unmanaged indexes do not include any transaction costs, management fees or other costs. It is not possible to make an investment directly in any index.
The volatility (beta) of an account may be greater or less than its respective benchmark.
The Consumer Price Index (CPI) measures the change in prices paid by consumers for goods and services. The CPI reflects spending patterns for each of two population groups: all urban consumers and urban wage earners and clerical workers.

