Stocks Hit New Highs as Bonds Face Headwinds of Higher Rates
HIGHLIGHTS:
- The NASDAQ Composite finally joined the S&P 500 and Dow Jones Industrial Average in achieving a new all-time high for the first time since 2021. Leap Day saw both the S&P 500 and NASDAQ close at all-time highs.
- Coinciding with stock prices at all-time highs, earnings are expected to hit an all-time high in 2023 once fourth quarter data is tallied for S&P 500 companies as well. Earnings are expected to grow once again in 2024 to new highs from their 2023 levels.
- After a year-end close of 3.88%, the 10-year U.S. Treasury yield has increased over the first two months of 2024. The yield closed January at 3.99% and ended February at 4.25%, which has pushed bond returns lower to start 2024.
- The U.S. economy continues to be much stronger than most expected. The second look at Q4 2023 GDP was 3.2% – only modestly lower than the original estimate and expected reading of 3.3%.
- There was no Fed meeting in February, but market expectations for rate cuts in 2024 have declined since the start of the year following the FOMC meeting that ended on January 31st and subsequent higher inflation readings in February.
EQUITY MARKETS
Stocks started strongly in 2024 with the S&P 500 and Dow Jones Industrial Average hitting new all-time highs in January. However, some of those gains were given up at the end of the month as the Fed lowered expectations of a rate cut at the March FOMC meeting.
February saw stocks bounce back and record a solid month of gains with the NASDAQ Composite joining the new all-time high party in February. Although the month of February saw a broader stock market advance, it is noteworthy that the market fell back into its recent pattern of large-cap growth stocks outperforming most other areas of the market. For example, the Russell 1000 Growth Index gained 6.82% in February, which pushed its year-to-date results (keep in mind only 2 months) to just shy of 10% at 9.49%. The Russell 1000 Value Index advanced “only” 3.69% in February, adding to modest gains in January for a year-to-date increase of 3.80%.
The equal-weighted S&P 500 Index was down in January, while the traditional, market cap weighted S&P 500 Index gained for the month reflecting again the outperformance of the mega-cap Technology companies. Both indices advanced in February, but the market cap weighted S&P 500 has started the year on a stronger note. Small-caps showed some strength in February after negative results in January. See Table 1 for equity results for February 2024, year to date, and calendar year 2023.
Table 1
| Index | February 2024 | YTD | 2023 |
|---|---|---|---|
| S&P 500 | 5.34% | 7.11% | 26.29% |
| S&P 500 Equal Weight | 4.16% | 3.31% | 13.87% |
| DJIA | 2.50% | 3.84% | 16.18% |
| Russell 3000 | 5.41% | 6.58% | 25.96% |
| NASDAQ Comp. | 6.22% | 7.33% | 44.64% |
| Russell 2000 | 5.65% | 1.54% | 16.93% |
| MSCI ACWI ex U.S. | 2.53% | 1.51% | 15.62% |
| MSCI Emerging Mkts Net | 4.76% | -0.11% | 9.83% |
2023 will be remembered for the dominance of large-cap growth and 2024 has started in a similar fashion. However, the market seemed to broaden once again in February as it had late in 2023. We believe the market could continue to broaden in 2024 with valuations more compelling in value, small, mid-cap and international stocks.
International stocks continued to underperform U.S. equities with emerging markets among the weakest market areas to begin 2024. It was the only index in Table 1 in negative year-to-date territory. We still see opportunities in international markets with valuations that are significantly lower than the U.S. and our expectation is that the U.S. dollar will likely weaken over the short to intermediate-term as the Fed begins cutting rates in 2024.
Fixed Income
After struggling for much of 2023, bonds rallied in November and December to turn in solid results for the year. After peaking in late October, yields dropped sharply through year end, but rates have subsequently moved higher in 2024. It is a good reminder that yields can move quickly at times, which is why we believe it is important for bond investors to stay focused on their long-term goals during periods of volatility.
The 10-year U.S. Treasury yield closed 2023 at 3.88% and moved up to end January at 3.99%. The yield continued to move higher in February closing the month at 4.25%, which has created a headwind for bonds to begin the new year. See Table 2 for fixed income index returns for February 2024, year to date, and calendar year 2023.
Table 2
| Index | February 2024 | YTD | 2023 |
|---|---|---|---|
| Bloomberg U.S. Agg | -1.41% | -1.68% | 5.53% |
| Bloomberg U.S. Credit | -1.44% | -1.62% | 8.18% |
| Bloomberg U.S. High Yld | 0.29% | 0.29% | 13.44% |
| Bloomberg Muni | 0.13% | -0.38% | 6.40% |
| Bloomberg 30-year U.S. TSY | -2.14% | -4.78% | 1.93% |
| Bloomberg U.S. TSY | -1.31% | -1.59% | 4.05% |
The move higher in rates in February was a challenge for most bond sectors. High yield bonds and munis eked out modest gains for the month, but only high yield is in the green year to date. The more interest rate sensitive bonds like longer dated U.S. Treasuries have come under the most pressure so far this year. We expect the 10-year U.S. Treasury yield to drift lower as we move through 2024 and believe it will be in a range between 3.25% and 4.5% during the year. As the Fed begins to cut rates in 2024, we believe this will drive down rates at the front end of the yield curve as well.
We maintain our long-standing position favoring credit versus pure rate exposure in this interest rate environment. We also believe the role bonds play in a portfolio, to provide stable cash flow and to help offset the volatility of stocks in the long run, has not changed. Furthermore, we believe that bond yields remain attractive (particularly with the recent move higher in rates) even though rates have dropped from their October highs. In our opinion, having an active approach to managing fixed income can help navigate these volatile times.
Economic Data and Outlook
Economic data from the first month of 2024 showed an economy that continued to be strong – and some might argue a few readings were even “hot.” The second reading of Q4 GDP continued to reflect that 2023 closed on a strong note with 3.2% annualized growth, just a tick below the prior estimate of 3.3%. The Atlanta Fed GDPNow estimate for first quarter growth (as of March 1) shows the economy running at an estimated 2.1% pace for the first quarter of 2024. We do expect growth to slow in 2024 from 2023, but we also think the odds favor a soft landing and not a recession at this point. Our expectation for GDP growth in 2024 is 2.25%, which is right around our long-term trend expectation for growth in the U.S. economy.
One ongoing reason we continue to expect growth in the economy comes from strength in the job market. Non-farm payroll additions were a blowout 353,000 in January, nearly doubling expectations of 185,000. Just as impressive, the December payroll number was revised to 333,000 job additions from the prior reading of 216,000. The unemployment rate stayed at 3.7% when it was expected to tick higher to 3.8%. As a consumer-based economy, the strength in the job market has been a key driver of economic growth.
Average hourly earnings grew by 4.5% on an annual basis, which was “hotter” than expectations of 4.1%. So, overall, we saw businesses hire a significant number of workers to begin the year and average hourly earnings increase for workers. While this could keep some pressure on inflation, it also means a lot more working Americans will have more income to spend. That math will likely continue to play out for a while longer as we are still in a situation with millions more job openings than unemployed people in the U.S. economy.
We acknowledge that several Technology companies announced layoffs early this year and we will monitor whether that becomes a bigger macroeconomic theme, or if it is more contained to the Technology sector.
Chart 1 shows monthly non-farm payroll additions for the last three years. While it is probably too early to call it a trend, job market gains have trended higher in recent months. We also need to remember that payroll additions in 2021 and 2022 were very strong and still in recovery mode from the pandemic-related shutdowns and the corresponding rehiring of workers as the economy reopened.
Chart 1
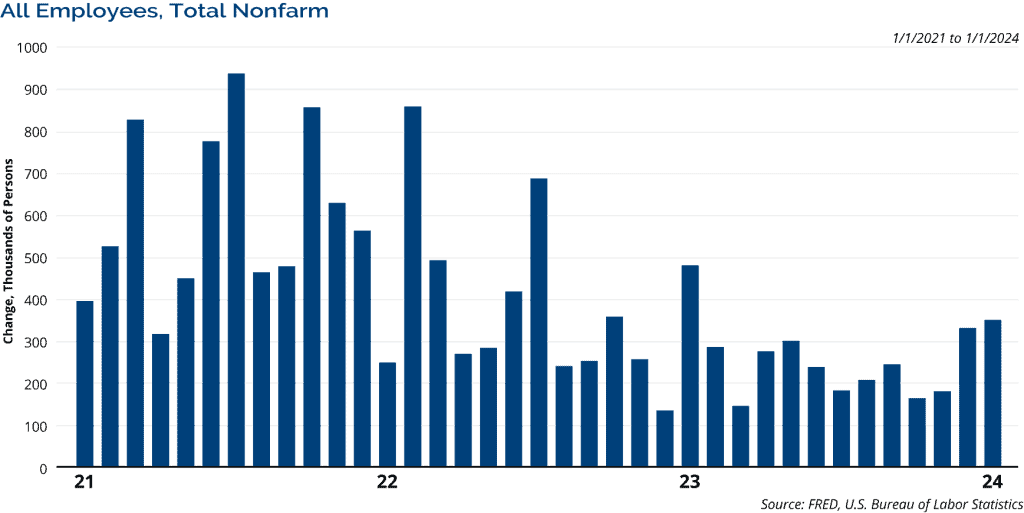
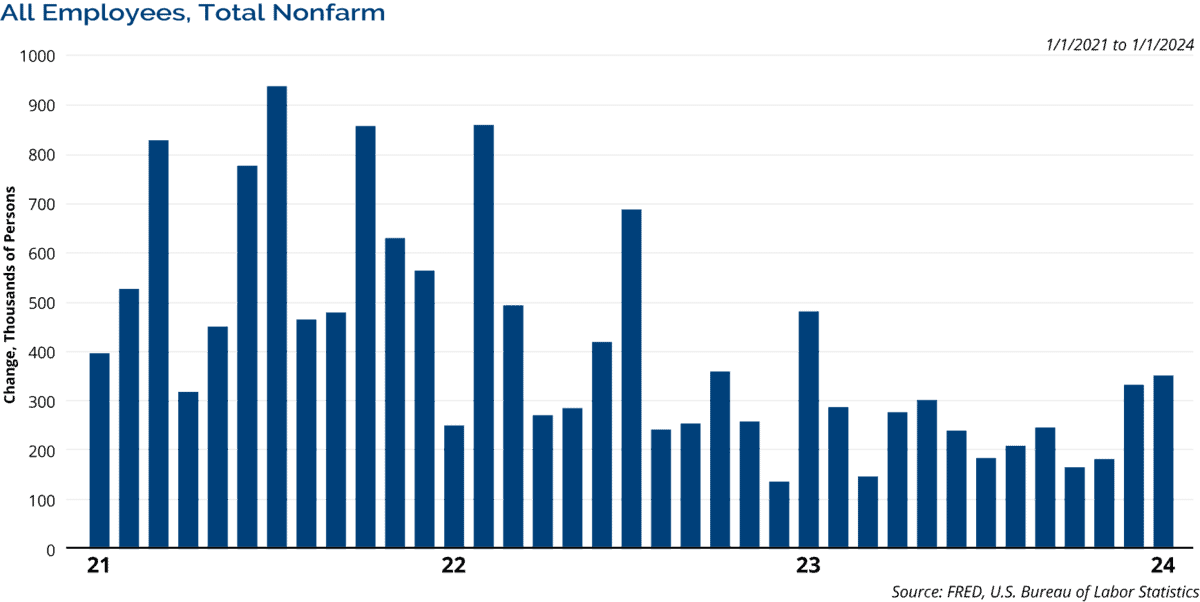
For illustrative purposes only.
With the current strength in the job market, we still believe that it is unlikely that the economy would slow too drastically under these conditions. However, even a modest slowdown in the job market could be a headwind to economic activity due to the central role that consumer spending plays in the U.S. economy. Moving into 2024, we expect the economy will slow, but that we will likely avoid a recession. We are expecting the economy to make a “soft landing.” Even if a recession developed, we believe it would be mild due to the strength of the consumer. We believe opportunities exist in the stock and bond markets under either a slow growth or mild recession economic scenario.
Inflation data for January could also be deemed “hot” compared to expectations. For January, the headline Consumer Price Index (CPI) showed an annual increase of 3.1%, which was higher than expectations of 2.9%. The core CPI showed an annual gain of 3.9% compared to expectations of 3.7%. The headline Producer Price Index (PPI) rose by 0.9% on an annual basis in January when a 0.6% gain was anticipated. The core PPI had an annual increase of 2.0% in January, again, higher than expectations of 1.6%.
It is important to note that while these readings were higher than expected, headline CPI and PPI for January were both lower than the annual increase in December and core CPI was flat. Only the core PPI number showed a higher annual increase in January compared to December. We do not expect this sort of data to decline in a straight line and some periods of volatility should be expected. We would argue that the trend is still clearly showing improvements made regarding inflation and that the Fed will cut rates during 2024 due to this improvement.
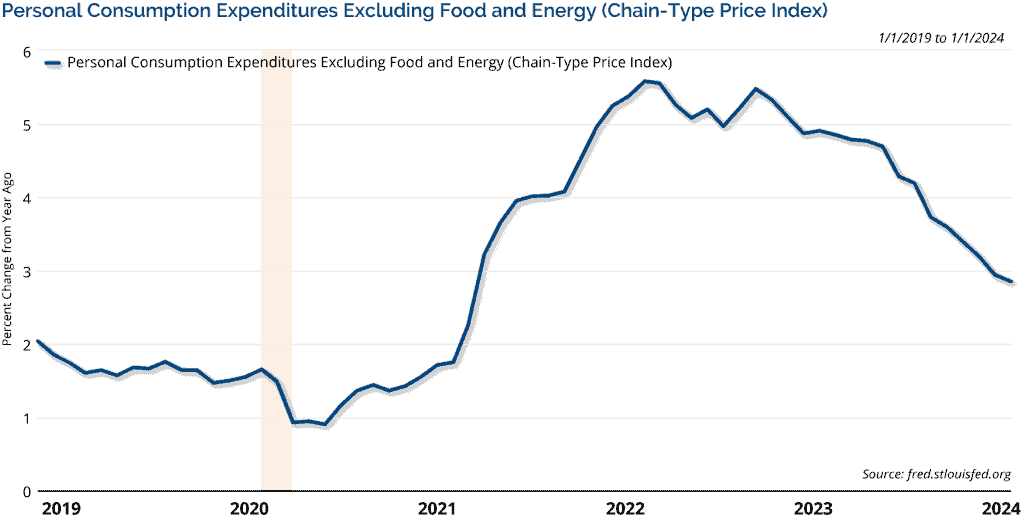
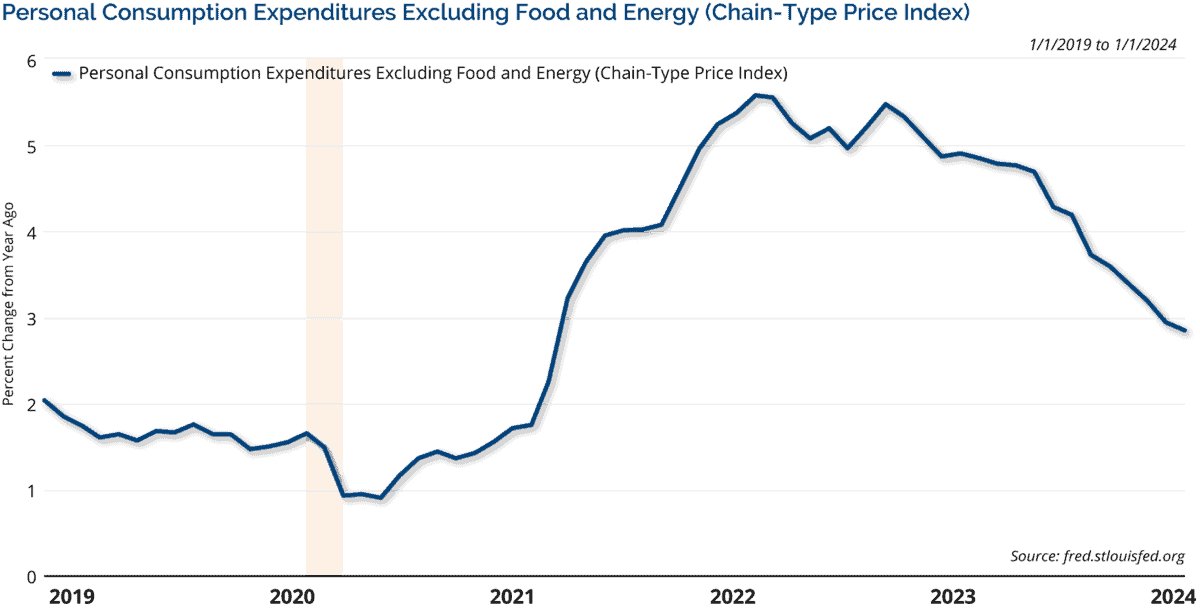
Focusing on the preferred inflation measure of the Fed, the Personal Consumption Expenditures (PCE) Index came out on the last day of February (which covers the month of January) and was in line with expectations. The headline PCE Index had an annual increase of 2.4% in January as expected and below the 2.6% increase for the year in December. The core PCE reading (the reading the Fed targets) was 2.8%, which was in line with expectations and a modest improvement from December’s annual increase of 2.9%. Chart 2 shows the core PCE Price Index has improved and is trending lower, but it remains above the Fed’s long-term target of around 2%. The trend lower appears intact.
Chart 2
Progress has been made on inflation. The Fed appears comfortable that no more rate increases are needed at this point and that rate cuts will occur in 2024. To start the year, the market, based on fed fund futures, was anticipating too many cuts compared to what the Fed was indicating. After the FOMC meeting at the end of January and the “hot” CPI reading released in February, market expectations, according to the CME FedWatch Tool, showed 4 expected cuts in 2024. This reading is very fluid, and it can change frequently. However, market expectations have come more in line with our internal estimate of 4 rate cuts this year.
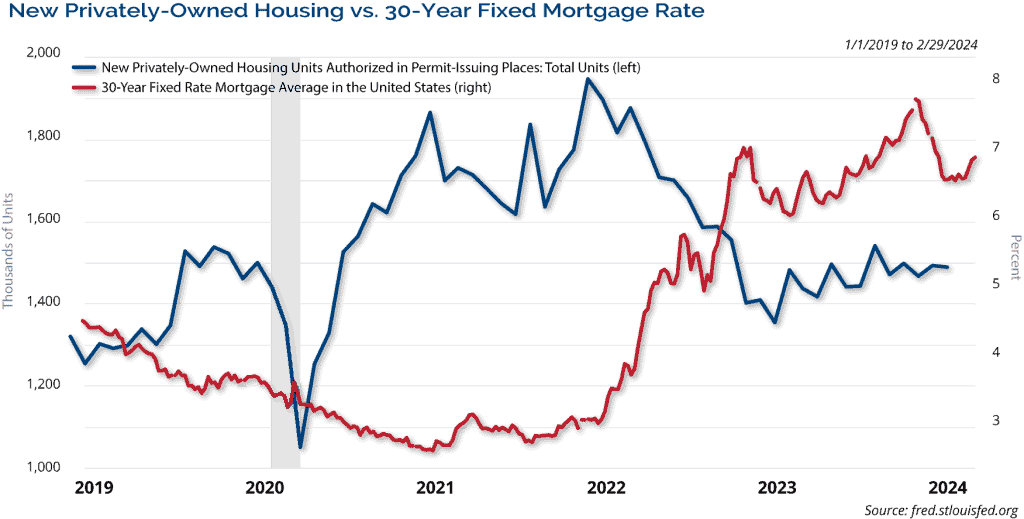
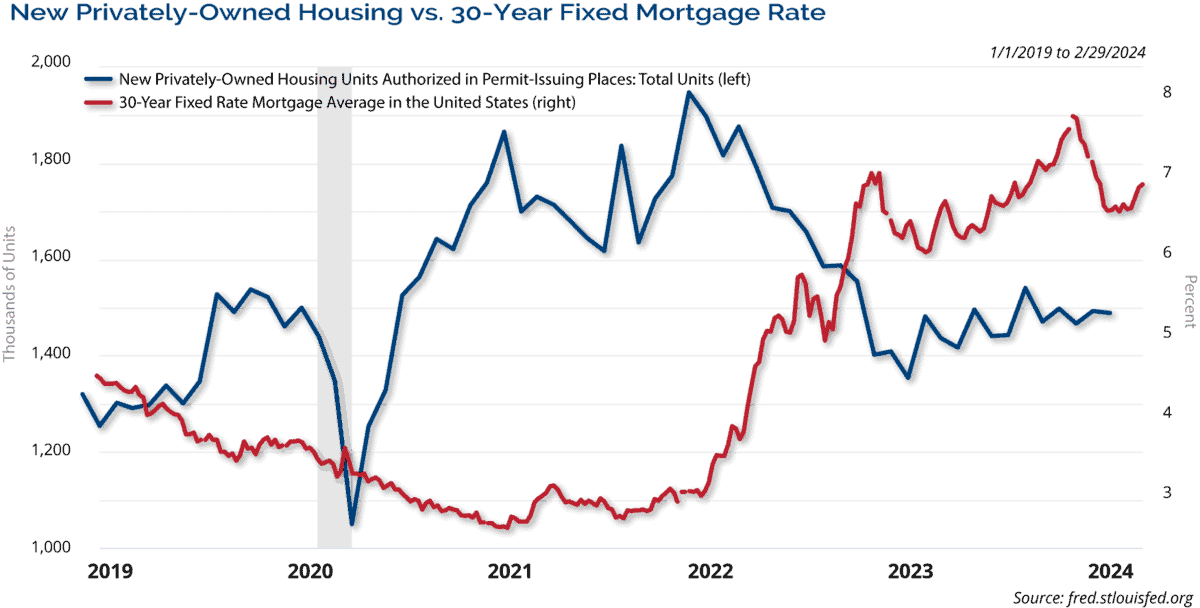
Housing data was a little weaker in January and was likely impacted by the move higher in interest rates, and subsequently mortgage rates, to start the year. In January, building permits and housing starts were both lower than expectations and both declined from their December levels.
New home sales missed expectations, but due to a revision lower for the December number, they increased in January. Existing home sales stood out by surpassing expectations and improving from December. The S&P CoreLogic 20-City Index of home prices rose by 6.13% on an annual basis in December, beating expectations of 6.05% and improving from the 5.41% annual increase in November. It will be important to see how housing reacts as rates have bounced higher from their 2024 close at the outset of the new year. Chart 3 shows the relationship between mortgage rates and building permits, which are considered a leading indicator in housing.
Chart 3
At 49.1, the ISM Manufacturing Index for January surpassed expectations of 47.2, but still marked the 15th straight month of contraction for this index. (The February reading was released March 1 and it disappointed at 47.8 when expectations were at 49.5). The ISM Non-Manufacturing Index, which covers the much larger service industries in the U.S. economy, improved to 53.4 in January, which was ahead of estimates at 52.0. The service industries still reflected growth in January, which has helped lift the overall economy, and that growth picked up in January compared to the end of last year. Recall, the dividing line between expansion and contraction for the ISM indices is 50.
The health of U.S. consumers is in perpetual focus due to the consumer’s significant role in the U.S. economy. Retail sales (ex. auto and gas) dropped by a surprising -0.5% in January, when a 0.2% monthly gain was anticipated. The preliminary University of Michigan Sentiment reading for February ticked higher to 79.6 from the prior month reading of 79.0, but it was slightly below the expected 80 reading. Consumer confidence has remained elevated amid a strong job market and the stock market reaching all-time highs.
The Conference Board’s Leading Index declined by -0.4% in January compared to expectations of a -0.3% drop. For almost two years, the leading economic index has been flashing a warning sign of pending economic weakness, which has yet to materialize to any large degree. In fact, The Conference Board, which maintains the leading economic index, dropped its forecast for a U.S. recession in 2024.
As always, we believe it is imperative for investors to stay focused on their long-term goals and not let short-term swings in the market derail them from their longer-term objectives.
Investment Implications
Clark Capital’s Top-Down, Quantitative Strategies
It’s been a strong start to the year and a strong month for the markets, with both the S&P 500 and Nasdaq closing at record highs. Right now, it seems like nothing matters in the market except momentum. February marked the fourth straight month of gains with the S&P 500 closing above 5,000 and rising 16 of the last 18 weeks for the first time in over 50 years.
In addition, it was only the 17th time in over 90 years that the four months preceding March were positive. The takeaway from the market action here is that “momentum usually begets more momentum.”
Clark Capital’s Bottom-Up, Fundamental Strategies
Corporate earnings have been resilient and consumer spending remains robust. Tailwinds for the market include A.I., positive takes on small-cap performance, a rising focus on corporate operational efficiency, M&As, buyback authorizations, and dividend increases.
Q4 earnings season is winding down with the blended earnings growth rate for the S&P near 4% versus the 1.5% expected at the end of that quarter. Credit remains firm while duration has suffered with the repricing of fewer Fed rate cuts expected.
ECONOMIC DATA
| Event | Period | Estimate | Actual | Prior | Revised |
|---|---|---|---|---|---|
| ISM Manufacturing | Jan | 47.2% | 49.1 | 47.4 | 47.1 |
| ISM Services Index | Jan | 52.0 | 53.4 | 50.6% | 50.5 |
| Change in Nonfarm Payrolls | Jan | 185k | 353k | 216k | 333k |
| Unemployment Rate | Jan | 3.80% | 3.70% | 3.70% | — |
| Average Hourly Earnings YoY | Jan | 4.10% | 4.50% | 4.10% | 4.30% |
| JOLTS Job Openings | Dec | 8750k | 9026k | 8790k | 8925k |
| PPI Final Demand MoM | Jan | 0.10% | 0.30% | -0.10% | — |
| PPI Final Demand YoY | Jan | 0.60% | 0.90% | 1.00% | — |
| PPI Ex Food and Energy MoM | Jan | 0.10% | 0.50% | 0.00% | -0.10% |
| PPI Ex Food and Energy YoY | Jan | 1.60% | 2.00% | 1.80% | 1.70% |
| CPI MoM | Jan | 0.20% | 0.30% | 0.30% | 0.20% |
| CPI YoY | Jan | 2.90% | 3.10% | 3.40% | — |
| CPI Ex Food and Energy MoM | Jan | 0.30% | 0.40% | 0.30% | — |
| CPI Ex Food and Energy YoY | Jan | 3.70% | 3.90% | 3.90% | — |
| Retail Sales Ex Auto and Gas | Jan | 0.20% | -0.50% | 0.60% | — |
| Industrial Production MoM | Jan | 0.20% | -0.10% | 0.10% | 0.00% |
| Building Permits | Jan | 1512k | 1470k | 1495k | 1493k |
| Housing Starts | Jan | 1460k | 1331k | 1460k | 1562k |
| New Home Sales | Jan | 684k | 661k | 664k | 651k |
| Existing Home Sales | Jan | 3.97m | 4.00m | 3.78m | 3.88m |
| Leading Index | Jan | -0.30% | -0.40% | -0.10% | -0.20% |
| Durable Goods Orders | Jan P | -5.00% | -6.10% | 0.00% | -0.30% |
| GDP Annualized QoQ | 4Q S | 3.30% | 3.20% | 3.30% | — |
| U. of Mich. Sentiment | Feb P | 80.00 | 79.60 | 79.00 | — |
| Personal Income | Jan | 0.40% | 1.00% | 0.30% | — |
| Personal Spending | Jan | 0.20% | 0.20% | 0.70% | — |
| S&P CoreLogic CS 20-City YoY NSA | Dec | 6.05% | 6.13% | 5.40% | 5.41% |
Past performance is not indicative of future results. The opinions referenced are as of the date of publication and are subject to change due to changes in the market or economic conditions and may not necessarily come to pass. Material presented has been derived from sources considered to be reliable and has not been independently verified by us or our personnel. Nothing herein should be construed as a solicitation, recommendation or an offer to buy, sell or hold any securities, other investments or to adopt any investment strategy or strategies. Investors must make their own decisions based on their specific investment objectives and financial circumstances. Investing involves risk, including loss of principal.
Clark Capital Management Group is an investment adviser registered with the U.S. Securities and Exchange Commission. Registration does not imply a certain level of skill or training. More information about Clark Capital Management Group’s advisory services can be found in its Form ADV which is available upon request.
Fixed income securities are subject to certain risks including, but not limited to: interest rate (changes in interest rates may cause a decline in market value or an investment), credit, prepayment, call (some bonds allow the issuer to call a bond for redemption before it matures), and extension (principal repayments may not occur as quickly as anticipated, causing the expected maturity of a security to increase).
Clark Capital utilizes a proprietary investment model to assist with the construction of the strategy and to assist with making investment decisions. Investments selected using this process may perform differently than expected as a result of the factors used in the model, the weight placed on each factor, and changes from the factors’ historical trends. There is no guarantee that Clark Capital’s use of a model will result in effective investment decisions.
Non-investment-grade debt securities (high-yield/junk bonds) may be subject to greater market fluctuations, risk of default or loss of income and principal than higher-rated securities.
Foreign securities are more volatile, harder to price and less liquid than U.S. securities. They are subject to different accounting and regulatory standards and political and economic risks. These risks are enhanced in emerging market countries.
The value of investments, and the income from them, can go down as well as up and you may get back less than the amount invested.
Equity securities are subject to price fluctuation and possible loss of principal. Stock markets tend to move in cycles, with periods of rising prices and periods of falling prices. Certain investment strategies tend to increase the total risk of an investment (relative to the broader market). Strategies that concentrate their investments in limited sectors are more vulnerable to adverse market, economic, regulatory, political, or other developments affecting those sectors.
JOLTS is a monthly report by the Bureau of Labor Statistics (BLS) of the U.S. Department of Labor counting job vacancies and separations, including the number of workers voluntarily quitting employment.
The Core Consumer Price Index (CPI) is a measure of the average change over time in the prices paid by urban consumers for a market basket of consumer goods and services.
The Core Producer Price Index (PPI) program measures the average change over time in the selling prices received by domestic producers for their output. The prices included in the PPI are from the first commercial transaction for many products and some services.
The PCE price index, released each month in the Personal Income and Outlays report, reflects changes in the prices of goods and services purchased by consumers in the United States.
Earnings per share (EPS) is a company’s net profit divided by the number of common shares it has outstanding.
References to market or composite indices, benchmarks or other measures of relative market performance over a specified period of time (each, an “index”) are provided for your information only. Reference to an index does not imply that the portfolio will achieve returns, volatility or other results similar to that index. The composition of the index may not reflect the manner in which a portfolio is constructed in relation to expected or achieved returns, portfolio guidelines, restrictions, sectors, correlations, concentrations, volatility or tracking error targets, all of which are subject to change. Investors cannot invest directly in an index.
The Dow Jones Industrial Average® (The Dow®), is a price-weighted measure of 30 U.S. blue-chip companies. The index covers all industries except transportation and utilities.
The Bloomberg Barclays U.S. Municipal Index covers the USD-denominated long-term tax exempt bond market. The index has four main sectors: state and local general obligation bonds, revenue bonds, insured bonds and prerefunded bonds.
The Bloomberg US Treasury Index measures US dollar-denominated, fixed-rate, nominal debt issued by the US Treasury. Treasury bills are excluded by the maturity constraint, but are part of a separate Short Treasury Index.
The Dow Jones Industrial Average indicates the value of 30 large, publicly owned companies based in the United States.
The NASDAQ Composite is a stock market index of the common stocks and similar securities listed on the NASDAQ stock market.
The S&P 500 measures the performance of the 500 leading companies in leading industries of the U.S. economy, capturing 80% of U.S. equities.
The S&P 500® Equal Weight Index (EWI) is the equal-weight version of the widely-used S&P 500. The index includes the same constituents as the capitalization weighted S&P 500, but each company in the S&P 500 EWI is allocated a fixed weight – or 0.2% of the index total at each quarterly rebalance.
The University of Michigan Consumer Sentiment Index rates the relative level of current and future economic conditions. There are two versions of this data released two weeks apart, preliminary and revised. The preliminary data tends to have a greater impact. The reading is compiled from a survey of around 500 consumers.
The Russell 1000 Index is a stock market index that tracks the highest-ranking 1,000 stocks in the Russell 3000 Index, which represent about 93% of the total market capitalization of that index.
The iShares Russell 1000 Growth ETF seeks to track the investment results of an index composed of large- and mid-capitalization U.S. equities that exhibit growth characteristics.
The Russell 1000 Value Index measures the performance of the large-cap value segment of the U.S. equity universe. It includes those Russell 1000 Index companies with lower price-to-book ratios and lower forecasted growth values.
The Russell 2000 Index is a small-cap stock market index that represents the bottom 2,000 stocks in the Russell 3000.
The Russell 3000 Index measures the performance of the 3,000 largest U.S. companies based on total market capitalization, which represents approximately 98% of the investable U.S. equity market.
Nonfarm payrolls (NFPs) are the measure of the number of workers in the United States excluding farm workers and workers in a handful of other job classifications.
A municipal bond, commonly known as a muni, is a bond issued by state or local governments, or entities they create such as authorities and special districts.
The U.S. Treasury index is based on the recent auctions of U.S. Treasury bills. Occasionally it is based on the U.S. Treasury’s daily yield curve.
The 30 Year Treasury Rate is the yield received for investing in a US government issued treasury security that has a maturity of 30 years.
The 10 Year Treasury Yield is the yield received for investing in a US government issued treasury security that has a maturity of 10 year. The 10 year treasury yield is included on the longer end of the yield curve. Many analysts will use the 10 year yield as the “risk free” rate when valuing the markets or an individual security.
The Bloomberg Barclays U.S. Corporate High-Yield Index covers the U.S. dollar-denominated, non-investment grade, fixed-rate, taxable corporate bond market. Securities are classified as high-yield if the middle rating of Moody’s, Fitch, and S&P is Ba1/BB+/BB+ or below.
The Bloomberg Barclays U.S. Credit Index measures the investment grade, U.S. dollar denominated, fixed-rate taxable corporate and government related bond markets.
The Bloomberg Aggregate Bond Index or “the Agg” is a broad-based fixed-income index used by bond traders and the managers of mutual funds and exchange-traded funds (ETFs) as a benchmark to measure their relative performance.
The Bloomberg US Trsy Bellwethers 30Y is a U.S. Treasury debt obligation that has a maturity of 30 years.
The ISM Non-Manufacturing Index is an index based on surveys of more than 400 non-manufacturing firms’ purchasing and supply executives, within 60 sectors across the nation, by the Institute of Supply Management (ISM). The ISM Non-Manufacturing Index tracks economic data, like the ISM Non-Manufacturing Business Activity Index. A composite diffusion index is created based on the data from these surveys, that monitors economic conditions of the nation.
ISM Manufacturing Index measures manufacturing activity based on a monthly survey, conducted by Institute for Supply Management (ISM), of purchasing managers at more than 300 manufacturing firms.
The MSCI Emerging Markets Index captures large and mid cap representation across 27 Emerging Markets (EM) countries.
The MSCI ACWI ex USA Index captures large and mid cap representation across 22 of 23 Developed Markets (DM) countries (excluding the US) and 27 Emerging Markets (EM) countries*. With 2,359 constituents, the index covers approximately 85% of the global equity opportunity set outside the US
The S&P CoreLogic Case-Shiller 20-City Composite Home Price NSA Index seeks to measures the value of residential real estate in 20 major U.S. metropolitan areas. The U.S. Treasury index is based on the recent auctions of U.S. Treasury bills. Occasionally it is based on the U.S. Treasury’s daily yield curve.
The Leading Economic Index provides an early indication of significant turning points in the business cycle and where the economy is heading in the near term.
In the United States, the Core Personal Consumption Expenditure Price (CPE) Index provides a measure of the prices paid by people for domestic purchases of goods and services, excluding the prices of food and energy.
The VIX Index is a calculation designed to produce a measure of constant, 30-day expected volatility of the U.S. stock market, derived from real-time, mid-quote prices of S&P 500® Index (SPX℠) call and put options. On a global basis, it is one of the most recognized measures of volatility — widely reported by financial media and closely followed by a variety of market participants as a daily market indicator.
The Conference Board’s Leading Indexes are the key elements in an analytic system designed to signal peaks and troughs in the business cycle. The leading, coincident, and lagging economic indexes are essentially composite averages of several individual leading, coincident, or lagging indicators. They are constructed to summarize and reveal common turning point patterns in economic data in a clearer and more convincing manner than any individual component – primarily because they smooth out some of the volatility of individual components.
Gross domestic product (GDP) is the standard measure of the value added created through the production of goods and services in a country during a certain period.
CCM-993
![]()

