Stocks and Bonds Move Higher Amid a Volatile Month
HIGHLIGHTS:
- A couple regional bank failures sent concern through the market and volatility surged to its highest level of 2023. However, those events appeared more isolated, and stocks rallied in the second half of the month as volatility fell.
- The VIX Index, a measure of volatility, rose to just below 30 on an intraday basis in mid-March, but it moved steadily lower from that point and closed March at 18.70. That compares to a close of 20.70 at the end of February.
- Treasuries rallied and yields moved lower for most of March in a flight to quality. The 10-year U.S. Treasury yield crept above 4% in early March (closing at 4.08% on March 2) only to move lower from that point. It closed March at 3.48% and declining rates set up a solid backdrop for bond returns.
- The FOMC raised rates by 0.25% at its late March meeting as expected. However, it appears the Fed might be on hold following this meeting as it assesses incoming economic data as well as monitoring any banking issues that might yet appear.
- Economic data continued to be mixed but the job market remained strong. Furthermore, inflation data, which had negatively surprised to the upside in January, moderated in February as progress continues to be made on this front.
EQUITY MARKETS
As March progressed, a trend developed in the equity markets – large-cap growth companies moved into a leadership role and outperformed other areas of the stock market. Small-cap companies struggled as did more value-focused stocks. With volatility levels elevated, equity investors favored mega-cap technology companies with perceived strong balance sheets and solid cash flow characteristics. This resulted in a recovery in some pockets of equities in March, but other areas lagged. See Table 1 for equity results for March and the first quarter.
Table 1
| Index | February 2023 | Q1 2023 |
|---|---|---|
| S&P 500 | 3.67% | 7.50% |
| S&P 500 Equal Weight | -0.88% | 2.93% |
| DJIA | 2.08% | 0.93% |
| Russell 3000 | 2.67% | 7.18% |
| NASDAQ Comp. | 6.78% | 17.05% |
| Russell 2000 | -4.78% | 2.74% |
| MSCI ACWI ex U.S. | 2.44% | 6.87% |
| MSCI Emerging Mkts Net | 3.03% | 3.96% |
For example, the S&P 500 Index posted a solid gain of 3.67% in March, but looking at the S&P 500 on an equal-weighted basis showed the average stock was actually lower by -0.88%. Recall the S&P 500 Index is a market-cap weighted index and is becoming more and more dominated by mega-cap Technology companies and those stocks are the primary driver of this index’s returns.
More to this point, the broader market struggled as a handful of mega-cap Technology names rallied. The NASDAQ Composite stood out with the best results in March given its heavy exposure to Technology. Meanwhile, the Russell 2000 Index, a measure of small-cap companies, struggled in March owing much of that weakness to regional banks that are found in this index. International stocks fared well in March as the broader measure of international stocks, the MSCI ACWI ex U.S. Index, advanced along with emerging markets during the month.
On a year-to-date basis, significant divergences existed in the stock market. The theme that developed in the first quarter was the outperformance of large-cap growth stocks. The Russell 1000 Growth Index gained 6.84% for the month and was up 14.37% for the quarter. By contrast, the Russell 1000 Value Index declined -0.46% in March and gained a mere 1.01% during the first quarter. The decline in small-caps in March wiped out much of their quarterly gain with growth outperforming value in this space as well.
Fixed Income
After rising dramatically in February, the decline in rates was equally dramatic in March and bonds benefitted from this move lower in yields. As volatility mounted in the stock market, there was a flight to quality that drove Treasury yields down in March. The 10-year U.S. Treasury closed February at 3.92%, but by March’s end, the yield had dropped to 3.48%.
The more interest-rate sensitive parts of the bond market, like U.S. Treasuries, produced the strongest gains in fixed income in March, but bonds across most sectors advanced during the month. For example, a significant portion of the quarterly gains for the Treasury indices came from the returns in March. On the contrary, high yield bonds had the most modest gains for the month, but still showed some of the best results for the quarter due to progress made in January and February. Please see Table 2 for fixed income returns for March and the first quarter.
Table 2
| Index | February 2023 | YTD |
|---|---|---|
| Bloomberg U.S. Agg | 2.54% | 2.96% |
| Bloomberg U.S. Credit | 2.74% | 3.45% |
| Bloomberg U.S. High Yld | 1.07% | 3.57% |
| Bloomberg Muni | 2.22% | 2.78% |
| Bloomberg 30-year U.S. TSY | 4.55% | 5.99% |
| Bloomberg U.S. TSY | 2.89% | 3.01% |
We believe the move higher in rates in 2022 has largely run its course at the longer end of the yield curve and we expect the 10-year yield to move lower as we go through 2023. While volatile, that has occurred so far in 2023 with longer-dated yields declining, which we believe has set up a better return environment for bonds.
In previous Fed rate hike cycles, longer rates have started to come down before the Fed has stopped raising the Federal Funds rate and that pattern has played out this year as well. The situation with the regional banks and ongoing progress on inflation seems to be giving the Fed plenty of cover to pause its rate hikes. If not the ninth inning, we maintain our opinion that we are in the late innings of this rate hike cycle. We maintain our long-standing position favoring credit versus pure rate exposure in this interest rate environment. We also believe that the role bonds play in a portfolio, to provide stable cash flows and to help offset the volatility of stocks in the long run, has not changed.
Economic Data and Outlook
The economic momentum enjoyed by the U.S. economy in the second half of 2022 continued, as we expected, in early 2023. In February, non-farm payrolls advanced by 311,000 – once again surpassing estimates of 225,000. Although the unemployment rate unexpectedly rose to 3.6% when expectations were calling for it to remain at 3.4%, the labor force participation rate ticked higher when it was expected to show no growth. Chart 1 shows that the labor force participation rate has been steadily declining for years (driven in large part by baby boomers retiring), but the large drop because of the pandemic has started to steadily improve and is getting closer to pre-pandemic levels.
Chart 1.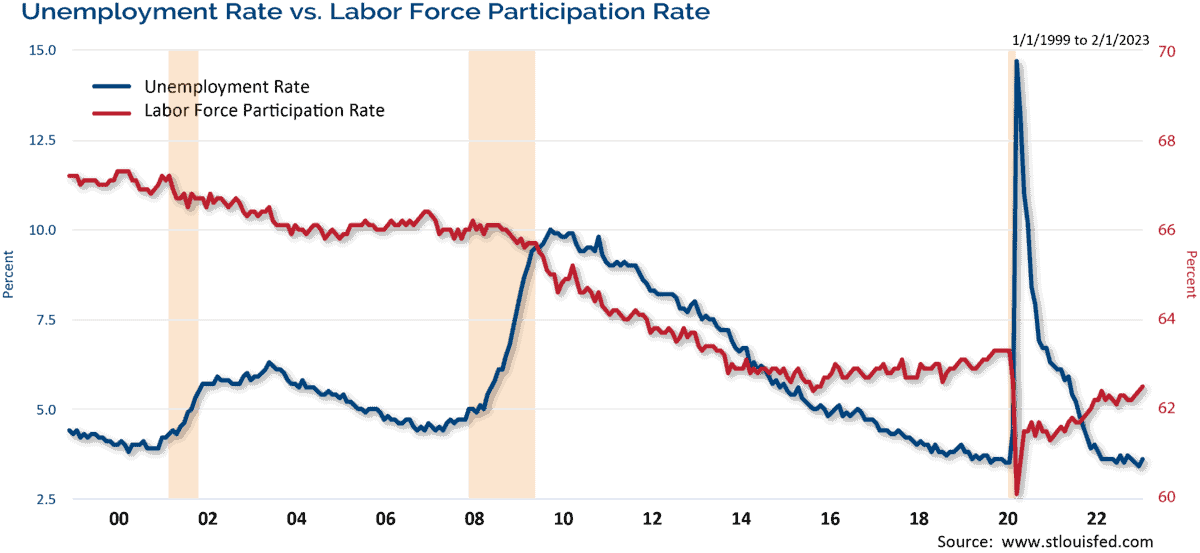
More people returning to the labor force would help the mismatch in job seekers versus job openings with millions more open jobs than people looking for work. The JOLTS reading on job openings surprised to the upside in January. Over 10.8 million job openings were reported in January, when just over 10.5 million openings were expected. The revised December mark showed more job openings than originally estimated at over 11.2 million.
Wages climbed by 4.6% on an annual basis, which was below expectations of 4.7%, but still higher than the prior month of 4.4%. The Fed aggressively raising rates over the last year is expected to raise unemployment, but Fed rate increases so far have not resulted in significant weakness in the job market outside of the tech sector. The Fed will likely watch job market data closely because readings that are too strong (in their opinion) could be viewed as inflationary and lead to additional rate hikes.
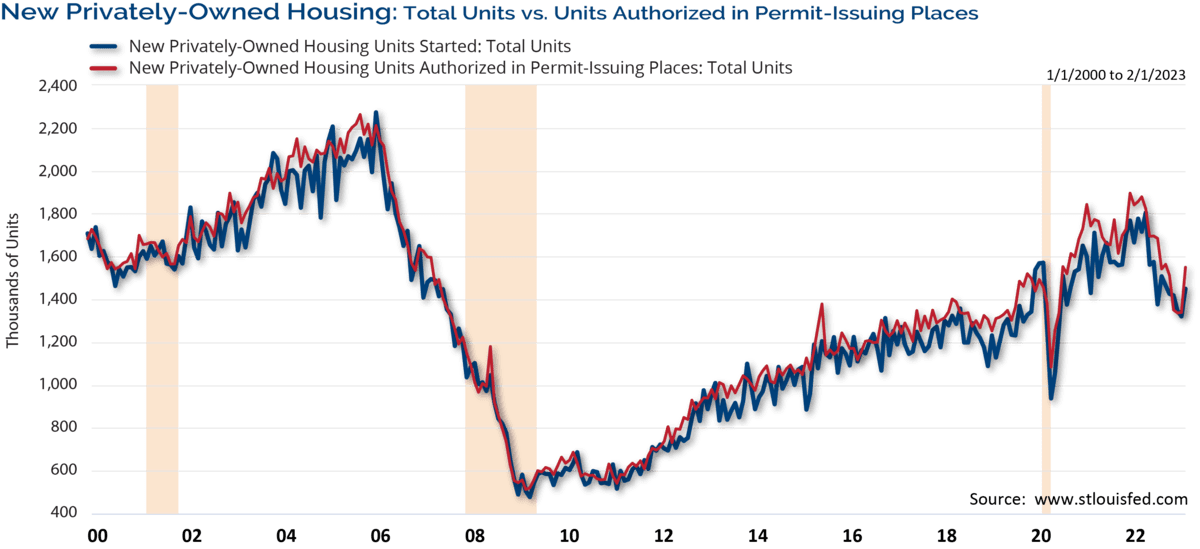
Housing continues to be impacted by changes in interest rates due to the direct impact on mortgage rates. Interest rates have been volatile this year and housing activity was largely better than expected in February. Building permits, considered a leading indicator for housing, surged in February at an annualized pace of 1.524 million. That compares to estimates of 1.342 million and the prior month’s level of 1.339 million. Furthermore, housing starts rose to a 1.45 million annual rate – easily surpassing estimates of 1.31 million and the prior month’s level of 1.321 million. Chart 2 shows the slowing trend in housing activity, but the bounce back in permits and starts in February.
Chart 2.
Existing home sales surpassed estimates as well at a 4.58 million pace when a reading of only 4.2 million was anticipated.
New home sales stood out as the only housing reading below estimates (640K versus 650K) but that was even better than the prior month of 633K. Housing prices continued to decline on a monthly basis but based on the S&P CoreLogic CS 20-City Index, home prices rose by 2.55% on an annual basis in January. Home prices have continued to decline over the last several months as mortgage rates have increased dramatically over the last year.
The ISM Manufacturing Index showed contraction for the 4th consecutive month in February with a reading of 47.7 – a modest improvement from January’s reading of 47.4, but below expectations of 48.0. (The reading for March marked a 5th straight month of contraction at 46.3 – the lowest level since May 2020.) The ISM Non-Manufacturing Index, which covers the much larger service industries in the U.S. economy, continued to show solid expansion with a reading of 55.1 in February – better than expectations of 54.5 and just modestly lower than the 55.2 mark from January. Recall that ISM readings above 50 indicate expansion and below 50 signal contraction.
Retail sales (ex. auto and gas) were flat in February when a -0.2% drop was anticipated. The prior month’s spending was revised higher by 0.2% to a 2.8% monthly increase. It is important to note that retail sales data is not inflation adjusted, so higher prices can drive stronger spending activity. The preliminary University of Michigan Sentiment reading for March dropped to 63.4 from the prior month’s mark and expectations of 67.0.
The Conference Board’s Leading Index continued to decline and fell by -0.3% in February as expected. The third and final reading of Q4 2022 GDP came in at a 2.6% annualized pace of growth, which was a slight decline from the prior estimate (and expectations) of 2.7%. The U.S. economy weakened in the first half of 2022, but it rebounded in the second half of the year and that economic momentum has continued into the first part of 2023. However, we expect growth to slow down later in the year and we acknowledge the risk of a mild recession has increased and we believe it is about as likely as a soft landing.
After disappointing January inflation data hit the market in February, inflation readings covering February, released in March were largely positive. The headline Consumer Price Index for February dropped to 6.0% as expected from 6.4%. The headline Producer Price Index fell to a 4.6% annual increase, which was much better than expectations of 5.4% and the prior month’s mark of 5.7%. The Fed’s preferred measure of inflation, the Personal Consumption Expenditures Index, dropped to 5.0% in February from a revised lower 5.3% in January and this beat expectations of 5.1%. Similarly, the core reading of the PCE Index (the primary way the Fed looks at inflation) showed a monthly increase of 0.3%, which was better than the 0.4% expected and an annual increase of 4.6%, a modest drop from the 4.7% increase from January. Chart 3 shows that the trend for inflation continues lower.
Chart 3.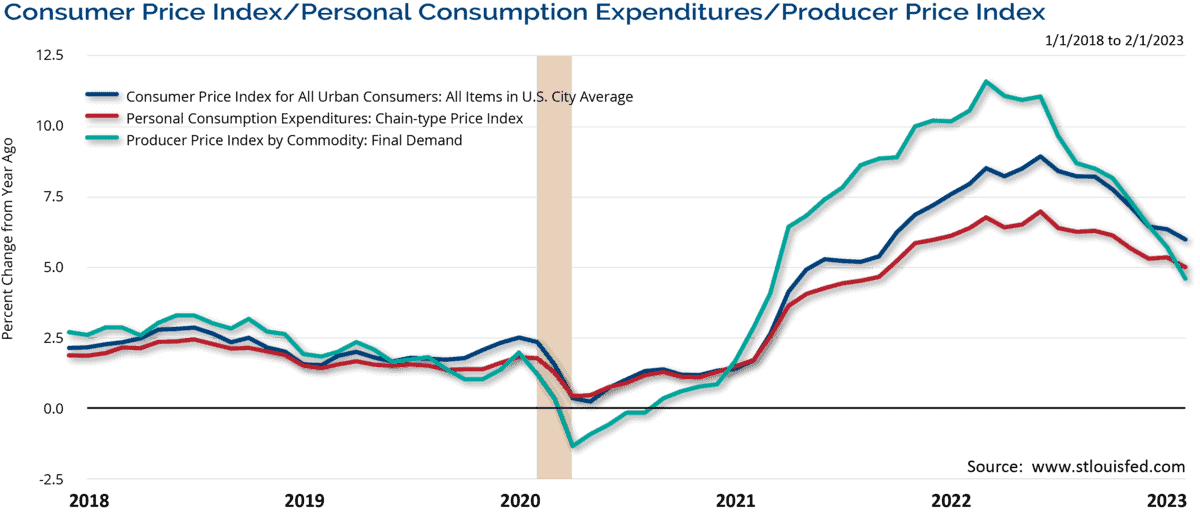
The Fed’s aggressive rate hikes impacted capital markets and the economy last year. Markets reset valuations based on higher interest rates and lower corporate earnings expectations in this rate-tightening cycle. However, we believe we are in the late innings of this rate hike cycle, particularly after the recent issues in some regional banks, which could result in the Fed taking a more cautious approach to additional rate hikes.
Although economic growth picked up in the second half of 2022 and we believe that momentum has continued early in the new year, we expect growth to slow later in 2023 and believe the odds of a mild recession are about 50/50. However, the job market has remained strong and is a critical component of our overall economy, leading us to the conclusion that any economic slowdown would be modest. As always, we believe it is imperative for investors to stay focused on their long-term goals and not let short-term swings in the market derail them from their longer-term objectives.
Investment Implications
Clark Capital’s Top-Down, Quantitative Strategies
Our tactical strategies, including Fixed Income Total Return and Global Tactical, were positioned in cash equivalents until mid-March. Our credit-based risk management models shifted toward favoring U.S. Treasuries, which regained relative strength as banking system stability came into question. Those strategies remained positioned defensively in U.S. Treasuries as the quarter ended.
Clark Capital’s Bottom-Up, Fundamental Strategies
The main priority in our fixed income portfolios last month was a focus on credit analysis. In particular, we were focused on ensuring that any banks held in the portfolios were not at risk of failing. Across our equity portfolios, we continue to focus on dividend growers and the quality factors that we believe can contribute to outperformance in the ongoing earnings downgrade cycle. Those factors include return on equity, profitability, earnings growth, and free cash flow.
ECONOMIC DATA
| Event | Period | Estimate | Actual | Prior | Revised |
|---|---|---|---|---|---|
| ISM Manufacturing | Feb | 48 | 47.7 | 47.4 | — |
| ISM Services Index | Feb | 54.5 | 55.1 | 55.2 | — |
| Change in Nonfarm Payrolls | Feb | 225k | 311k | 517k | 504k |
| Unemployment Rate | Feb | 3.40% | 3.60% | 3.40% | — |
| Average Hourly Earnings YoY | Feb | 4.70% | 4.60% | 4.40% | — |
| JOLTS Job Openings | Jan | 10546k | 10824k | 11012k | 11234k |
| PPI Final Demand MoM | Feb | 0.30% | -0.10% | 0.70% | 0.30% |
| PPI Final Demand YoY | Feb | 5.40% | 4.60% | 6.00% | 5.70% |
| PPI Ex Food and Energy MoM | Feb | 0.40% | 0.00% | 0.50% | 0.10% |
| PPI Ex Food and Energy YoY | Feb | 5.20% | 4.40% | 5.40% | 5.00% |
| CPI MoM | Feb | 0.40% | 0.40% | 0.50% | — |
| CPI YoY | Feb | 6.00% | 6.00% | 6.40% | — |
| CPI Ex Food and Energy MoM | Feb | 0.40% | 0.50% | 0.40% | — |
| CPI Ex Food and Energy YoY | Feb | 5.50% | 5.50% | 5.60% | — |
| Retail Sales Ex Auto and Gas | Feb | -0.20% | 0.00% | 2.60% | 2.80% |
| Industrial Production MoM | Feb | 0.20% | 0.00% | 0.00% | 0.40% |
| Building Permits | Feb | 1342k | 1524k | 1339k | — |
| Housing Starts | Feb | 1310k | 1450k | 1309k | 1321k |
| New Home Sales | Feb | 650k | 640k | 670k | 633k |
| Existing Home Sales | Feb | 4.20m | 4.58m | 4.00m | — |
| Leading Index | Feb | -0.30% | -0.30% | -0.30% | -— |
| Durable Goods Orders | Feb P | 0.20% | -1.00% | -4.50% | -5.00% |
| GDP Annualized QoQ | 4Q T | 2.70% | 2.60% | 2.70% | — |
| U. of Mich. Sentiment | Mar P | 67 | 63.4 | 67 | — |
| Personal Income | Feb | 0.20% | 0.30% | 0.60% | — |
| Personal Spending | Feb | 0.30% | 0.20% | 1.80% | 2.00% |
| S&P CoreLogic CS 20-City YoY NSA | Jan | 2.60% | 2.55% | 4.65% | 4.62% |
Source: Bloomberg
Past performance is not indicative of future results. The opinions referenced are as of the date of publication and are subject to change due to changes in the market or economic conditions and may not necessarily come to pass. Nothing herein should be construed as a solicitation, recommendation or an offer to buy, sell or hold any securities, other investments or to adopt any investment strategy or strategies. Investors must make their own decisions based on their specific investment objectives and financial circumstances. Investing involves risk, including loss of principal.
Clark Capital Management Group is an investment adviser registered with the U.S. Securities and Exchange Commission. Registration does not imply a certain level of skill or training. More information about Clark Capital Management Group’s advisory services can be found in its Form ADV which is available upon request.
Fixed income securities are subject to certain risks including, but not limited to: interest rate (changes in interest rates may cause a decline in market value or an investment), credit, prepayment, call (some bonds allow the issuer to call a bond for redemption before it matures), and extension (principal repayments may not occur as quickly as anticipated, causing the expected maturity of a security to increase).
Non-investment-grade debt securities (high-yield/junk bonds) may be subject to greater market fluctuations, risk of default or loss of income and principal than higher-rated securities.
Foreign securities are more volatile, harder to price and less liquid than U.S. securities. They are subject to different accounting and regulatory standards and political and economic risks. These risks are enhanced in emerging market countries.
The value of investments, and the income from them, can go down as well as up and you may get back less than the amount invested.
Equity securities are subject to price fluctuation and possible loss of principal. Stock markets tend to move in cycles, with periods of rising prices and periods of falling prices. Certain investment strategies tend to increase the total risk of an investment (relative to the broader market). Strategies that concentrate their investments in limited sectors are more vulnerable to adverse market, economic, regulatory, political, or other developments affecting those sectors.
The Bloomberg Barclays U.S. Municipal Index covers the USD-denominated long-term tax exempt bond market. The index has four main sectors: state and local general obligation bonds, revenue bonds, insured bonds and prerefunded bonds.
The Dow Jones Industrial Average indicates the value of 30 large, publicly owned companies based in the United States.
The NASDAQ Composite is a stock market index of the common stocks and similar securities listed on the NASDAQ stock market.
The S&P 500 measures the performance of the 500 leading companies in leading industries of the U.S. economy, capturing 75% of U.S. equities.
The University of Michigan Consumer Sentiment Index rates the relative level of current and future economic conditions. There are two versions of this data released two weeks apart, preliminary and revised. The preliminary data tends to have a greater impact. The reading is compiled from a survey of around 500 consumers.
The Russell 1000 Growth Index measures the performance of the large-cap growth segment of the U.S. equity universe. It includes those Russell 1000 Index companies with higher price-to-book ratios and higher forecasted growth values.
Russell 1000 Index measures the performance of the 1,000 largest companies in the Russell 3000 Index, which represents approximately 92% of the total market capitalization of the Russell 3000 Index.
The Russell 1000 Value Index measures the performance of the large-cap value segment of the U.S. equity universe. It includes those Russell 1000 Index companies with lower price-to-book ratios and lower forecasted growth values.
The Russell 2000 Index is a small-cap stock market index that represents the bottom 2,000 stocks in the Russell 3000.
The Russell 2000 Value Index measures the performance of the small-cap value segment of the U.S. equity universe. It includes those Russell 2000 companies with lower price-to-book ratios and lower expected and historical growth values.
The Russell 2000 Growth Index measures the performance of the small-cap growth segment of the U.S. equity universe.
The Russell 3000 Index measures the performance of the 3,000 largest U.S. companies based on total market capitalization, which represents approximately 98% of the investable U.S. equity market.
The 10 Year Treasury Rate is the yield received for investing in a US government issued treasury security that has a maturity of 10 year. The 10 year treasury yield is included on the longer end of the yield curve. Many analysts will use the 10 year yield as the “risk free” rate when valuing the markets or an individual security.
The 30 Year Treasury Rate is the yield received for investing in a US government issued treasury security that has a maturity of 30 years. The 30 year treasury yield is included on the longer end of the yield curve and is important when looking at the overall US economy.
Bloomberg Barclays U.S. Aggregate Bond Index: The index is unmanaged and measures the performance of the investment grade, U.S. dollar denominated, fixed-rate taxable bond market, including Treasuries and government-related and corporate securities that have a remaining maturity of at least one year.
The Bloomberg Barclays U.S. Corporate High-Yield Index covers the U.S. dollar-denominated, non-investment grade, fixed-rate, taxable corporate bond market. Securities are classified as high-yield if the middle rating of Moody’s, Fitch, and S&P is Ba1/BB+/BB+ or below.
The Bloomberg Barclays U.S. Credit Index measures the investment grade, U.S. dollar denominated, fixed-rate taxable corporate and government related bond markets.
The ISM Non-Manufacturing Index is an index based on surveys of more than 400 non-manufacturing firms’ purchasing and supply executives, within 60 sectors across the nation, by the Institute of Supply Management (ISM). The ISM Non-Manufacturing Index tracks economic data, like the ISM Non-Manufacturing Business Activity Index. A composite diffusion index is created based on the data from these surveys, that monitors economic conditions of the nation.
ISM Manufacturing Index measures manufacturing activity based on a monthly survey, conducted by Institute for Supply Management (ISM), of purchasing managers at more than 300 manufacturing firms.
The MSCI Emerging Markets Index captures large and mid cap representation across 27 Emerging Markets (EM) countries.
The MSCI ACWI ex USA Index captures large and mid cap representation across 22 of 23 Developed Markets (DM) countries (excluding the US) and 27 Emerging Markets (EM) countries*. With 2,359 constituents, the index covers approximately 85% of the global equity opportunity set outside the US.
The S&P CoreLogic Case-Shiller 20-City Composite Home Price NSA Index seeks to measures the value of residential real estate in 20 major U.S. metropolitan areas
The U.S. Treasury index is based on the recent auctions of U.S. Treasury bills. Occasionally it is based on the U.S. Treasury’s daily yield curve.
The CBOE Volatility Index, known by its ticker symbol VIX, is a popular measure of the stock market’s expectation of volatility implied by S&P 500 index options.
The Consumer Price Index (CPI) measures the change in prices paid by consumers for goods and services. The CPI reflects spending patterns for each of two population groups: all urban consumers and urban wage earners and clerical workers.
The Producer Price Index (PPI) program measures the average change over time in the selling prices received by domestic producers for their output. The prices included in the PPI are from the first commercial transaction for many products and some services.
CBOE Global Indices is a leader in the creation and dissemination of volatility and derivatives-based indices.
The Conference Board’s Leading Indexes are the key elements in an analytic system designed to signal peaks and troughs in the business cycle. The leading, coincident, and lagging economic indexes are essentially composite averages of several individual leading, coincident, or lagging indicators. They are constructed to summarize and reveal common turning point patterns in economic data in a clearer and more convincing manner than any individual component – primarily because they smooth out some of the volatility of individual components.
Index returns include the reinvestment of income and dividends. The returns for these unmanaged indexes do not include any transaction costs, management fees or other costs. It is not possible to make an investment directly in any index.
CCM-993
![]()

