Whitepaper: Benchmarking in the Passive Era


IN BRIEF
- We believe institutional and individual investors should rethink the assumption that an investment portfolio should be expected to provide the necessary cashflows to meet the financial objectives of the investor while also exceeding the returns of passive benchmarks.
- As passive investors have become an increasingly large part of the market, they begin to exert greater influence on returns as they transact.
- The increase in passive flows has caused securities to rapidly appreciate, irrespective of underlying fundamentals.
- Active managers can help consider the financial conditions of the investors they represent, select securities that reflect their financial needs, and may help provide the necessary cash flow for those future liabilities.
Beyond the Benchmark
One of the more durable impacts of the global financial crisis is the narrative that active managers, particularly in U.S. equity, have failed to consistently outperform benchmarks and justify their fees. Of course, active managers have hardly helped their cause in this regard. In their desire to attract new capital, they tend to focus on prior returns, awards, manager experience, etc. — all with the underlying message that they will be able to provide a better
return to the benchmark portfolio going forward.
Unfortunately from our perspective, what has been lost in the passive/active debate is the true purpose of active management to begin with: if a market represents the entire basket of risk, an active manager can exclude certain risk factors on behalf of the investor that are inappropriate given their objectives or risk tolerance. The obsessive focus on short-term benchmark performance by both managers and investors overlooks this crucial component of active management, which has nothing to do with relative returns, but instead focuses on individual goals with an emphasis on risk.
The purpose of this paper is not to argue against benchmarking, which has broadly been a tremendous public good for transparency and accountability. Rather, it is to contend that an evolution in how these tools are understood and utilized will be necessary to mitigate inadvertent and needless risk taking in client portfolios in the name of exceeding benchmark performance.
Consider that the performance metrics that are widely used today were created in the late 1960s and early 1970s. Critically, they make key assumptions about the behavior of market participants and price discovery. As Michael Green of Simplify Asset Management points out, a market is just a history of transactions. To understand what is happening at any given period, you need to consider who is transacting and why they are transacting. Today’s market looks very different from the participants 50 years ago, and the catalysts that cause them to transact are increasingly dissimilar.
This paper will examine how managers are currently evaluated, the assumptions underlying those performance metrics, and where those assumptions conflict with how market participants truly behave. We will then observe how that may inadvertently be increasing investor risk exposure, and lastly, how investors should consider evolving their view of manager performance.
Are Three Years Enough?
Today, investors are provided with a tremendous amount of data in the manager selection process. Managers are not only evaluated on their absolute return relative to a benchmark, but are also assessed on various risk metrics to determine what risk was taken to achieve those returns. It is an accepted practice to use three years as a significant enough period to determine manager skill. Now if we put ourselves in the place of an investor seeking to hire an investment manager, how would we utilize this data? Well, naturally we would segregate out the top performing managers from the poorer performing managers over that period and hire the winners.
If only it were so easy. It is universal to disclose that past performance does not equal future returns, yet past performance regrettably remains the guiding light for investment decision making. Research Affiliates conducted an eye-opening study of all the actively managed U.S. Equity funds in the Morningstar universe from 1990-2016. They found that the top 10% of performers over the prior rolling three-year period ended up in the bottom 10% during the following three-year period. What were the results for the bottom 10%? They ended up being in the top 10% of performers during the next three years.1
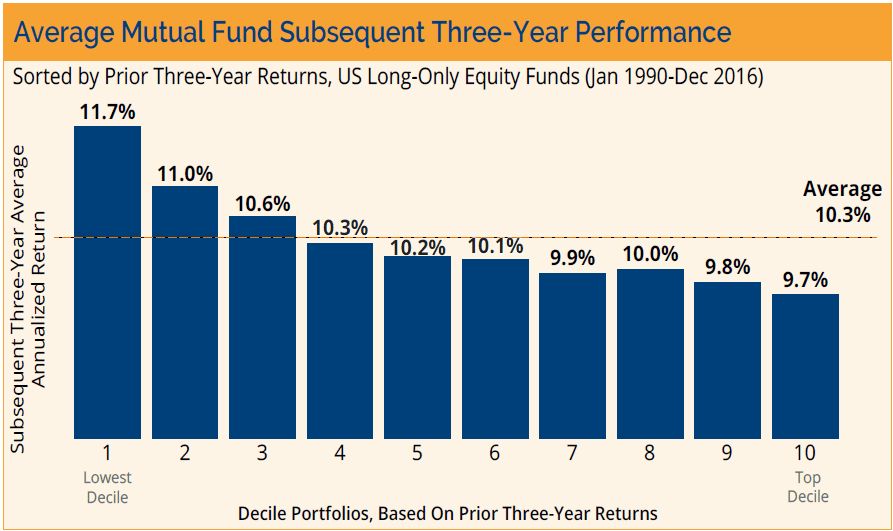
Source: Research Affiliates. For illustrative purposes only. Past performance is not indicative of future results.
Imagine being an investor with the stomach to identify the worst-performing managers over the last three years and invest with them. How many would have employed such a strategy? The data provided here is a compelling argument that a three-year period is far too small a sample size to evaluate an investment manager. Even worse, if that data were used to hire the perceived top performing managers, the investor would be left with the worst performing portfolio during an incredibly robust period of U.S. equity returns. Small wonder we see the narrative that active management is unable to keep up with the market.
Passive Is Anything but Passive
Beyond the issue of how much time an investor should provide a manager to demonstrate their skill, we should also reflect on what the baseline assumptions are in the models that we are using to evaluate the results. While there are any number of ratios and metrics we could choose from, for our purposes, we will focus on the Sharpe Ratio as it is generally adopted and accepted as a metric for active managers.
In his 1991 paper The Arithmetic of Active Management, William Sharpe posits that, “a passive investor always holds every security in the market, with each represented in the same manner as the market.”2 When comparing the Sharpe Ratio of an actively managed portfolio to the respective passive benchmark, there are several vital assumptions that are being made:
- The benchmark does not trade
- Market participants are transacting based on perfect rationality
- Securities are priced to reflect all information both public and private
- Frictionless transactions
- Market participants are all roughly the same size in terms of capital
The main thrust of Sharpe’s argument is that simply buying the benchmark offers a free ride. Let the more expensive active managers conduct price discovery while you can, for a much lower cost, simply own the benchmark which will ultimately incorporate their views.
In their paper “Policy in a World of Pandemics, Social Media, and Passive Investing” Michael Green and Wayne Himmelsein make a critical observation: “There is a key assumption that the investor holds the market portfolio. How does the investor get in? Apparently, magic. How does the investor get out? This would also be magic.”3 Active investors need to understand that they are not comparing themselves to a static portfolio, but rather to a portfolio that is actively trading daily based on incoming and outgoing flows and changing constituents in the index. Lasse Pederson of AQR highlights the ramifications of owning a truly passive strategy:
“Consider what happens to an investor who starts off with the market portfolio but never trades after that. The solid blue line shows an investor who bought the entire US stock market in 1926 and did not participate in any IPOs, SEOs, or share repurchases and did not reinvest any dividends, showing the resulting fraction of the market that is owned over time. We see that the investor gradually owns a smaller and smaller fraction of the market because he does not buy shares in the new firms and in the equity offerings of old firms. Already after 10 years of not trading, the inactive investor only owns about 60% of the market. The other lines show the same for investors who start in 1946, 1966, 1986, and 2006.”4
Simply put, passive is anything but passive. These portfolios must, by rule, actively trade in order to reflect their assigned index.
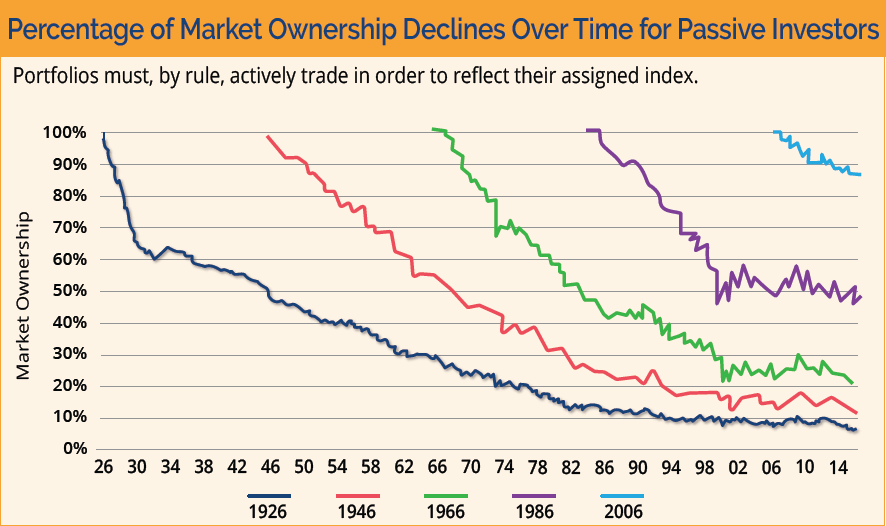
Source: AQR. For illustrative purposes only. Past performance is not indicative of future results.
Passive Influence Has Grown
As passive investors have become an increasingly large part of the market (Logica estimates that passive vehicles represent approximately 43% of U.S. equity ownership, growing at a 3% annual rate), they begin to exert greater influence on returns as they transact.
Parker, Schoar, and Sun at the National Bureau of Economic Research have demonstrated that Target Date Funds (TDFs) alone are exerting meaningful influence over the returns in the S&P 500 constituents where TDFs have a greater percentage of ownership. Within their research they found that the impact became much more significant since the Pension Protection Act was passed in 2006, which essentially made TDFs the default investment vehicle for 401(k)s. This becomes more worrisome when we consider that passive investors do not deliberate over fundamentals or price when they trade. Unwittingly, they assume that price discovery has already occurred.5
To put it simplistically, if we think back to our university days when we were assigned a group project, what is the result when the group members assume that everyone else has done the work? Vanguard’s Joe Davis illustrates what may be the result of this dynamic in the chart below, although in fairness, he attributes economic reasons for this outcome rather than the structural ones that are argued for in this paper.6
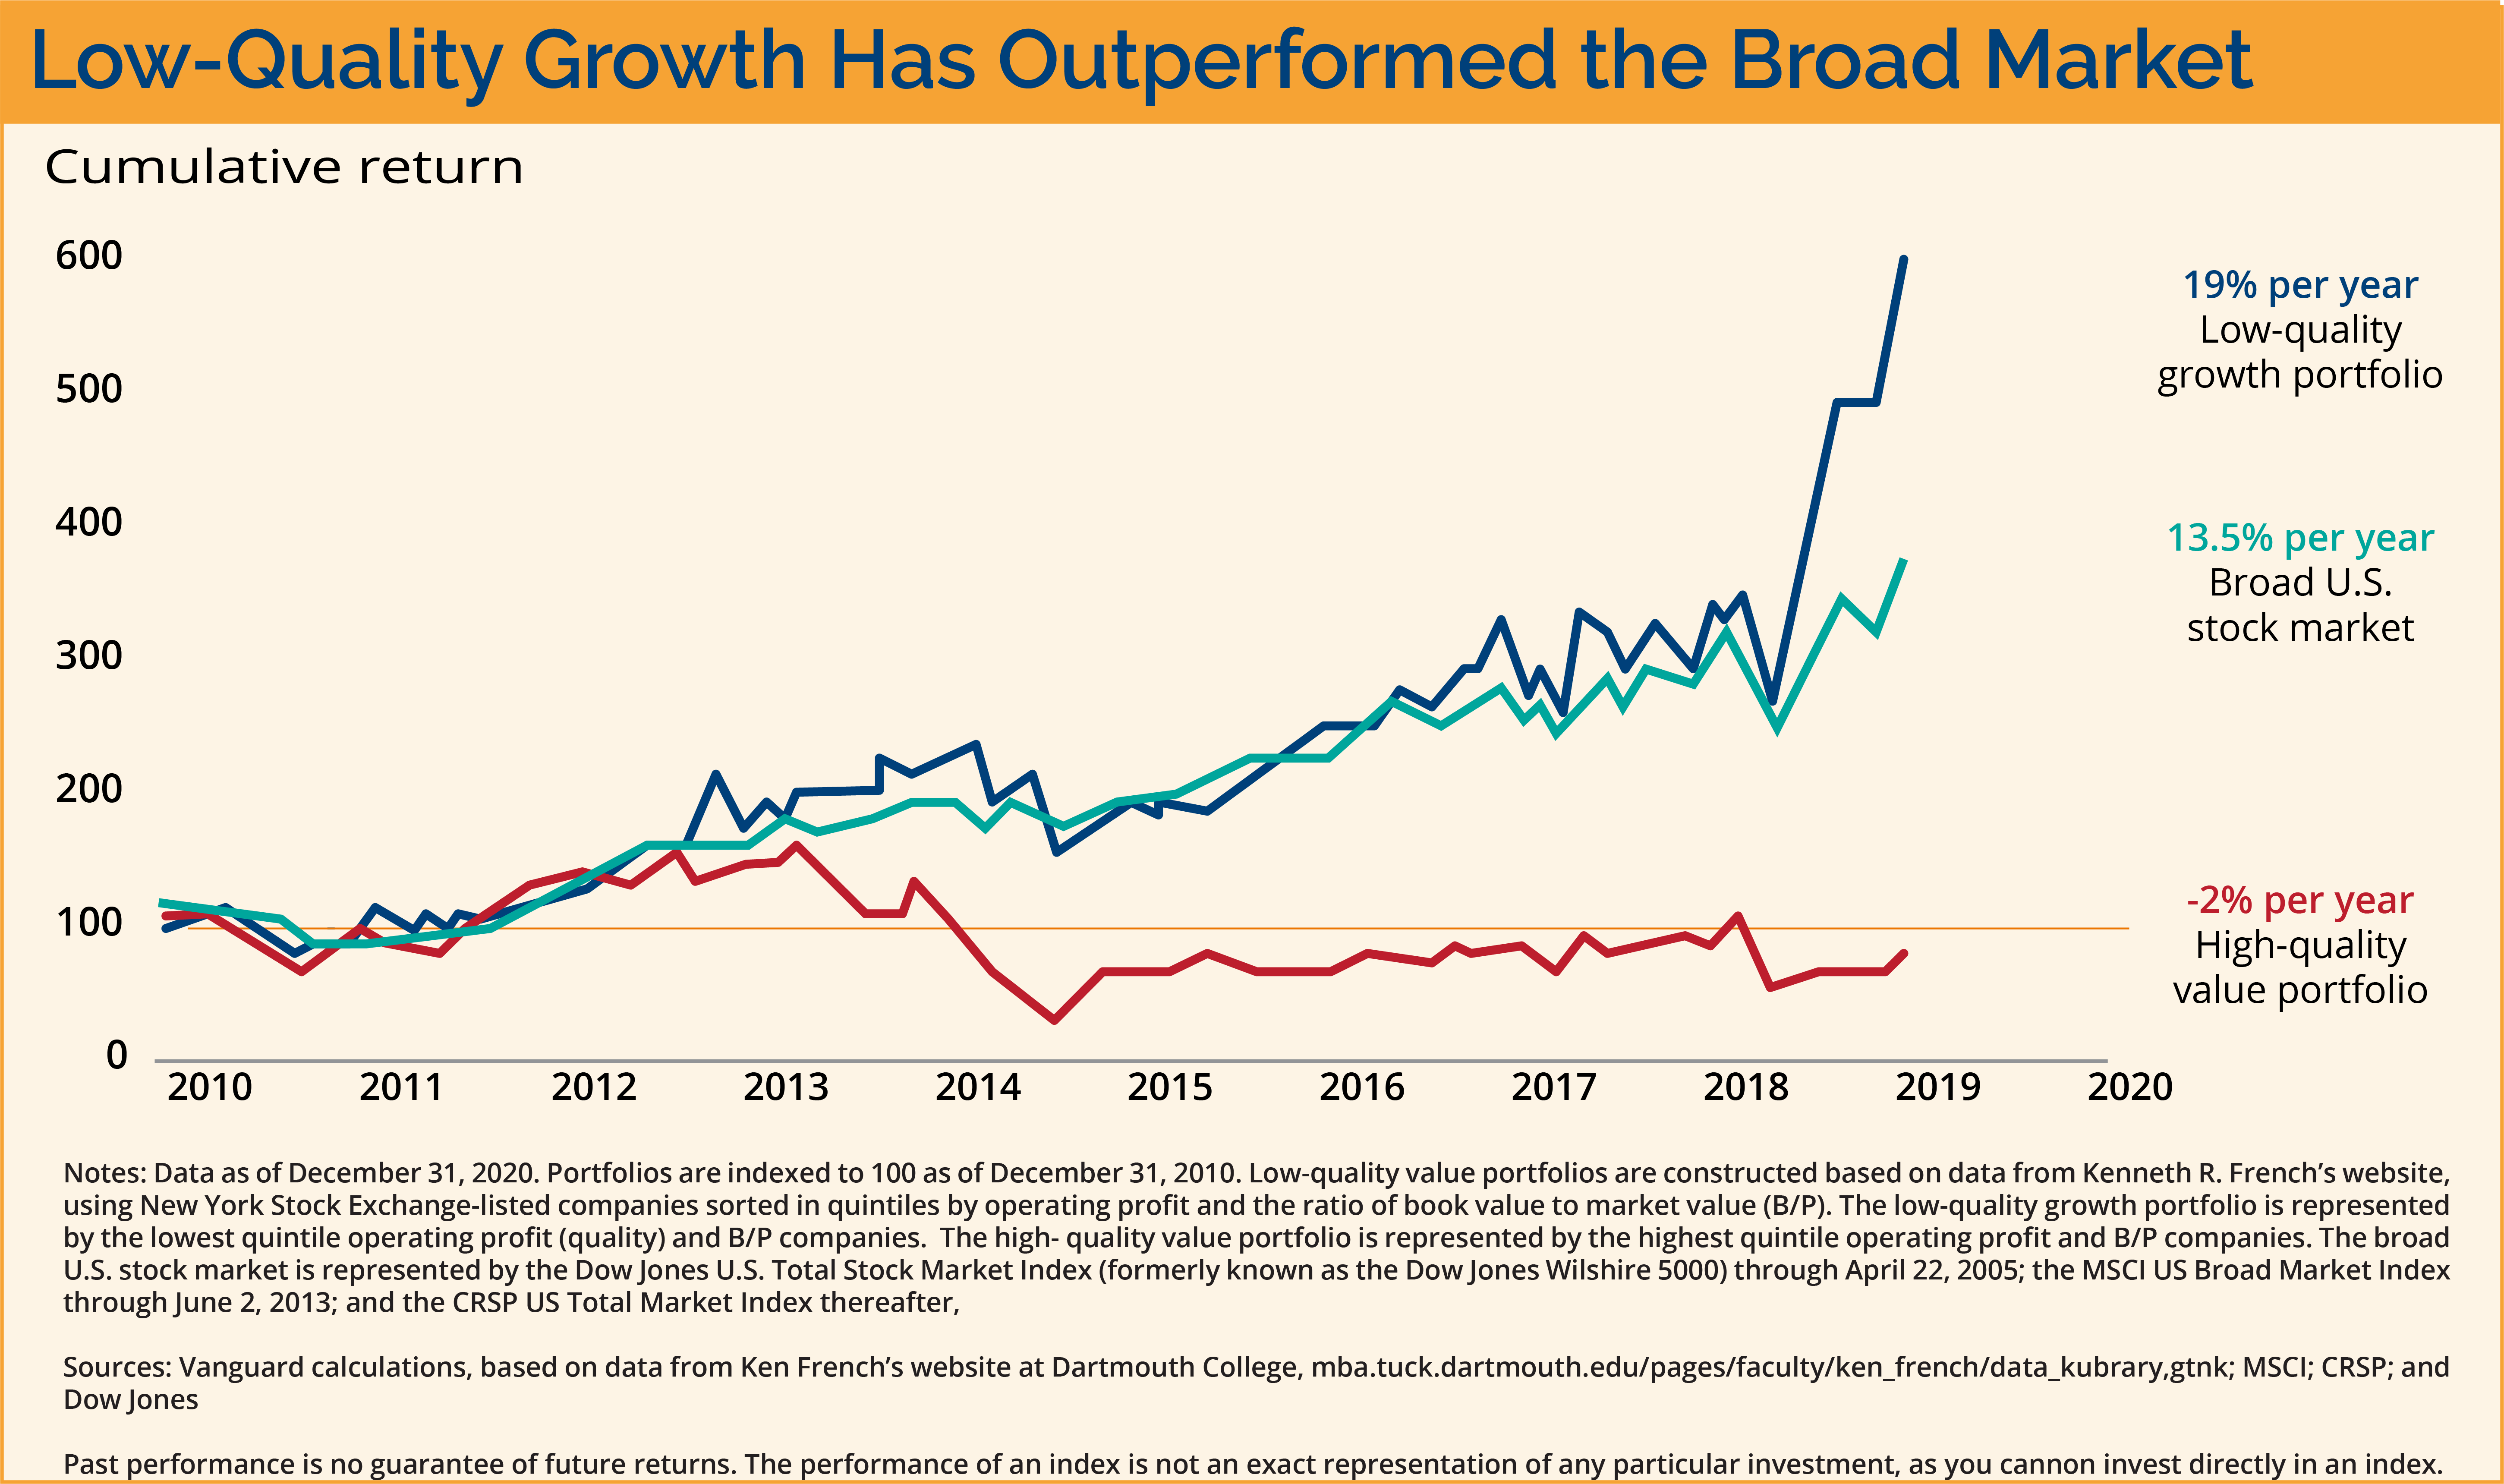 There have been numerous conjectures and reasons posited for why we are seeing the outperformance of companies that have low to no operating profits. Everything from low interest rates supporting higher stock prices to massive stimulus from the Federal Reserve; it’s a new economy where companies are being given a much longer runway by their shareholders, ad infinitum.
While these rationales may make sense at a surface level, the explanation for these results might be much simpler. Passive vehicles are an increasingly dominant part of U.S. equity ownership. They are receiving over 100% of U.S. equity flows and they buy and sell at any price because they must, by rule, presume that every price at any given time reflects all public and nonpublic information. Passive flows then become a vital component in driving market returns, which we will examine next.
Remember a key assumption in the Efficient Market Hypothesis framework, which is the foundation of passive investing, is that transacting is frictionless. A dollar coming in or out of the market will only move the market by that amount. Xavier Gabaix and Ralph Koijen challenge this theory and demonstrate a 5x symmetrical multiplier which has considerable implications for what the effect of flows are in security prices.7
Extrapolating the implications of their thesis, the momentum effect on benchmarks will be drastic (remember they are float weighted), where the top performing securities gain more incoming capital as new flows come in while lower performing stocks receive less. The result of this action being that the benchmarks themselves may be able to become concentrated in a way that an active manager, as governed by the 1940 Act or simple judiciousness, may not. Recent returns of momentum versus value provide considerable weight to the thesis as Logica points out below:
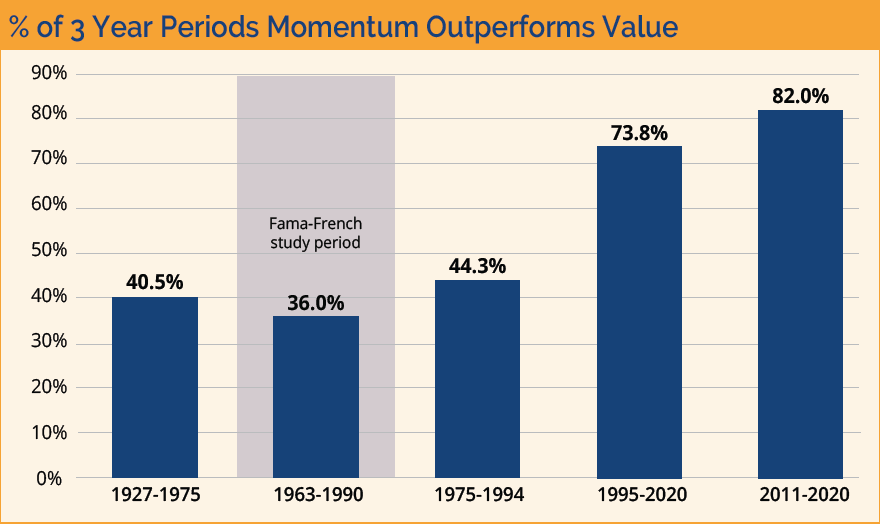
Source: Kenneth L. French Data Library For illustrative purposes only. Past performance is not indicative of future results.8
We believe this framework puts active managers in a progressively more difficult position. Securities that are rapidly appreciating for no other reason than increased flows can create a meaningful return gap in relative performance. They are up against a buyer that will only buy more as the price increases, irrespective of underlying fundamentals.
Compound that with the concentration required to match a benchmark return that is float weighted which would fall outside of any definition of prudence for a manager to even have a neutral relative position. This feedback loop of passive flows reinforcing momentum and price has also impacted the providers themselves. In 2019, passive index providers asked the SEC for relief from enforcement of certain requirements listed under the Investment Company Act of 1940.9 Specifically, what they point out in their request to the SEC is that by simply tracking their assigned index the funds would no longer be able to claim they are diversified.
Many of the indices they were tracking were becoming heavily concentrated in just a few securities and would put them offsides of the regulation. The SEC’s response was to cite that since the objective of the funds is simply to match an assigned index, they would not engage in enforcement actions on that basis.9 It is difficult to imagine an investor castigating their manager for meeting or exceeding recent benchmark returns. Paradoxically, under the current market framework, that may be precisely the appropriate reaction.
Conclusion
We conclude that both institutional and individual investors should rethink the assumption that an investment portfolio should be expected to provide the necessary cashflows to meet the financial objectives of the investor while also exceeding the returns of passive benchmarks. From the individual retiree to the largest pension funds, they all rely on annual distributions and can ill afford to weight their portfolios towards companies that are not profitable. Those types of stocks require a much longer runway to meet their fundamental business objectives.
This time horizon often does not align with a portfolio where the ultimate objective is to enter a distribution phase where consistent cash flows will be required. We believe investors must evolve in their understanding of what an investment strategy can reasonably achieve. The data illustrates that a portfolio can seek to exceed benchmark returns or be designed to provide for the financial needs of the Investor. While there are times when both objectives may be met, sometimes those objectives may in fact be at odds with one another.
Returning to the outset of this paper, the purpose is not to suggest that benchmarking is a fruitless exercise. But by having a lens into the return profile of a basket of securities with a similar profile to the securities that an active manager has selected, it may provide a helpful picture of what is driving broader markets and how an active portfolio is reacting to those factors.
What we have demonstrated is that a security’s price movements in the current market environment is not information about the robustness and cash flow generating potential of the underlying company that the stock represents. Active managers exist to consider the financial conditions of the investors they represent, select securities that reflect their financial needs, and seek to provide the necessary cashflow for those future liabilities.
No matter the investor, from a charitable endowment to an individual retiree, we believe chasing even three-year benchmark returns is a treacherous endeavor that serves only to distract from the original investment objectives of the portfolio. We believe investors employing active managers would be well-served to keep these considerations in mind as they continue to evaluate and measure their returns.
Sources
- Arnott, Rob, 2019, Are Valuations Irrelevant, Research Affiliates 2019 Advisor Symposium Presentation
- Sharpe, William F., 1991, The Arithmetic of Active Management, The Financial Analysts Journal Vol. 47, pp 7-9
- Himmelsein, Wayne and Green, Michael, 2020, Policy in a World of Pandemics, Social Media, and Passive Investing, Logica Capital Advisors
- Pedersen, Lasse Heje, 2018, Sharpening the Arithmetic of Active Management, Financial Analysts Journal, Vol. 74, pp 21-36
- Parker, Jonathan A., Schoar, Antoinette, and Sun, Yang, 2020, Retail Financial Innovation and Stock Market Dynamics: The Case of Target Date Funds, National Bureau of Economic Research, Working Paper 28028
- Davis, Joe, 2021, Asset Bubbles and Where to Find Them, The Vanguard Group
- Gabaix, Xavier and Koijen, Ralph S., 2020, In Search of the Origins of Financial Fluctuations: The Inelastic Markets Hypothesis, Swiss Finance Institute Research Paper 20-91
- Fama, Eugene, and French, Kenneth R., 1993, Common Risk Factors In The Returns On Stocks and Bonds, Journal of Financial Economics Vol. 33 pp 3-56
- U.S. Securities and Exchange Commission, RESPONSE OF THE CHIEF COUNSEL’S OFFICE DIVISION OF INVESTMENT MANAGEMENT, Stradley Ronon Stevens & Young, LLP, June 24, 2019, https://www.sec.gov/investment/stradley-062419
The opinions The opinions referenced are as of the date of publication and are subject to change due to changes in the market or economic conditions and may not necessarily come to pass. There is no guarantee of the future performance of any Clark Capital investment portfolio. Material presented has been derived from sources considered to be reliable, but the accuracy and completeness cannot be guaranteed. Nothing herein should be construed as a solicitation, recommendation or an offer to buy, sell or hold any securities, other investments or to adopt any investment strategy or strategies. For educational use only. This information is not intended to serve as investment advice. This material is not intended to be relied upon as a forecast or research. The investment or strategy discussed may not be suitable for all investors. Investors must make their own decisions based on their specific investment objectives and financial circumstances. Past performance does not guarantee future results.
The relative strength measure is based on historical information and should not be considered a guaranteed prediction of market activity. It is one of many indicators that may be used to analyze market data for investing purposes.
The Sharpe ratio is used to help investors understand the return of an investment compared to its risk. The ratio is the average return earned in excess of the risk-free rate per unit of volatility or total risk. Volatility is a measure of the price fluctuations of an asset or portfolio.
With a float-adjusted index, the value of each constituent reflects the value estimated to be available to investors in the public markets. Reducing the relative investment index investors have in stocks with limited float should enhance the investability of the index.
Investing involves risk, including loss of principal. The value of investments, and the income from them, can go down as well as up and you may get back less than the amount invested.
Indexes are unmanaged and you cannot invest directly in an index.
Clark Capital Management Group, Inc. is an investment adviser registered with the U.S. Securities and Exchange Commission. Registration does not imply a certain level of skill or training. More information about Clark Capital’s advisory services can be found in its Form ADV which is available upon request.
CCM-930