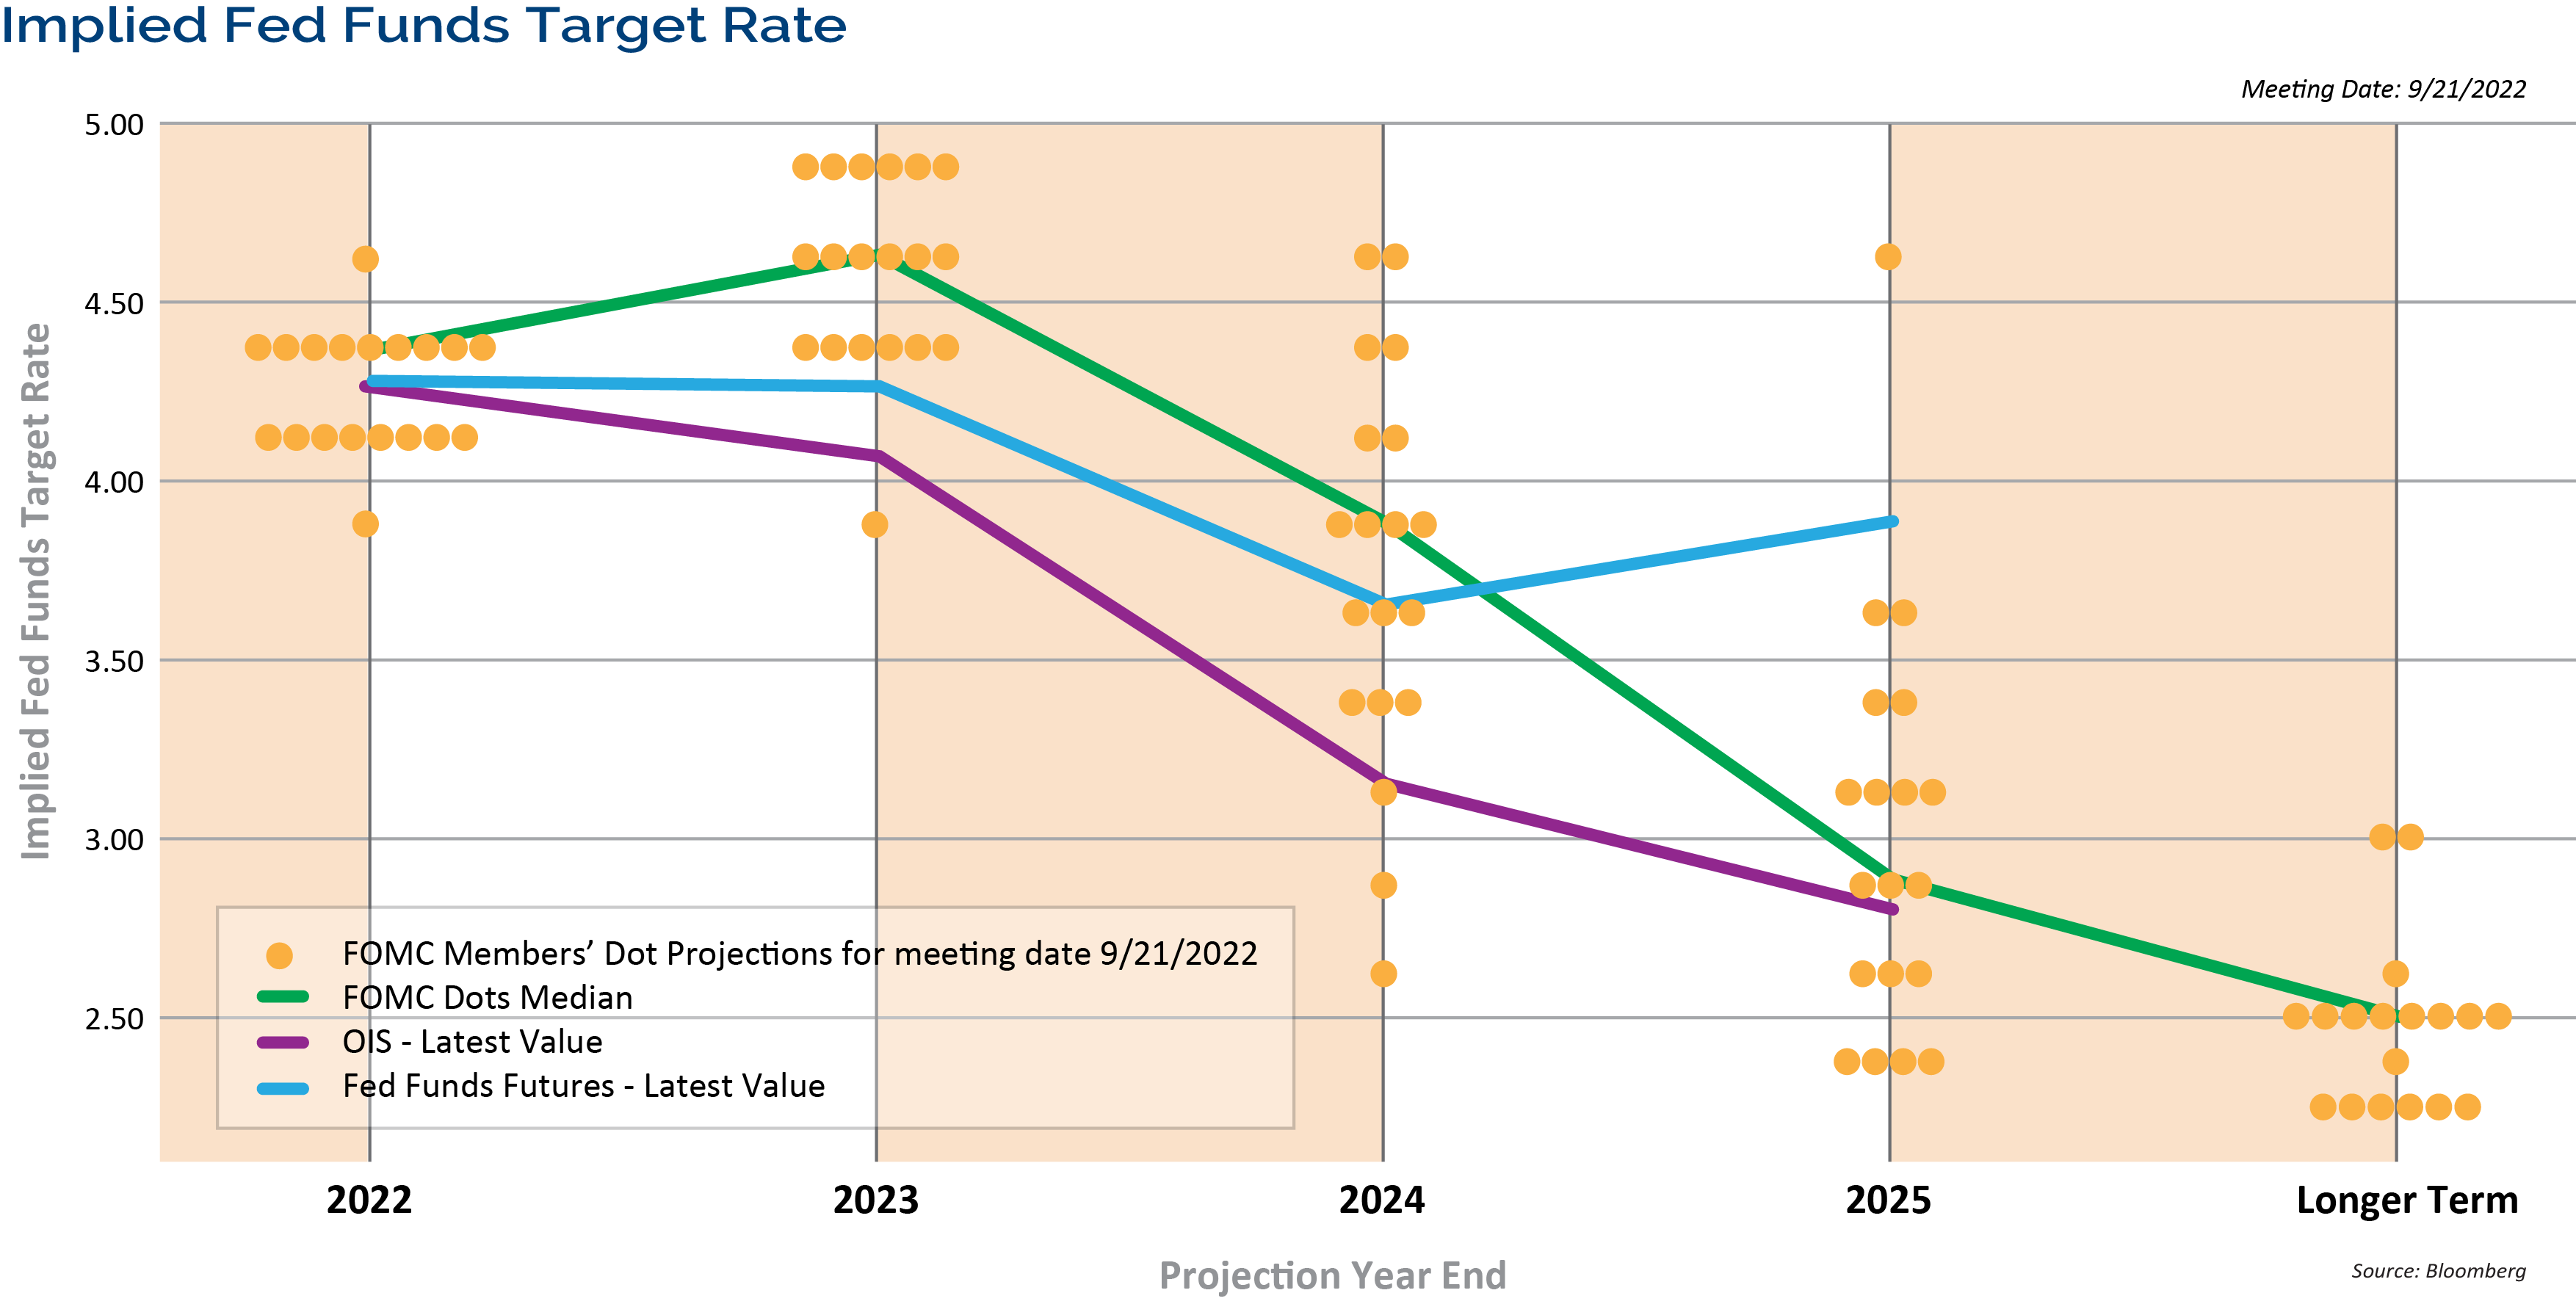
September 22, 2022 | The Federal Reserve delivered another outsized interest rate hike on Wednesday in an effort to weaken demand and contain inflation. The FOMC raised the funds rate target range by 75 bps to 3.0%-3.25%, as widely expected. The median rate expectation in the Fed’s Summary of Economic Projections now shows a funds rate of 4.375% by year-end, and 4.625% by the end of 2023, both up significantly from the Fed’s own projections in June. This means more rate hikes are likely coming. The market is now pricing in another 75 bps hike in November, a 50 bps hike in December, and another hike in early 2023.
The Fed also expects economic growth to slow to 1.2% in 2023, the unemployment rate increasing to 4.4%, and Core Personal Consumption Expenditures (PCE) at 3.1%. Last month, Fed Chairman Powell said restoring price stability will require a sustained period of below-trend growth and will bring “some pain to households and businesses.” The Fed’s statements and those projections indicate that the Fed is willing to keep rates higher for longer even in the face of some damage to the economy.
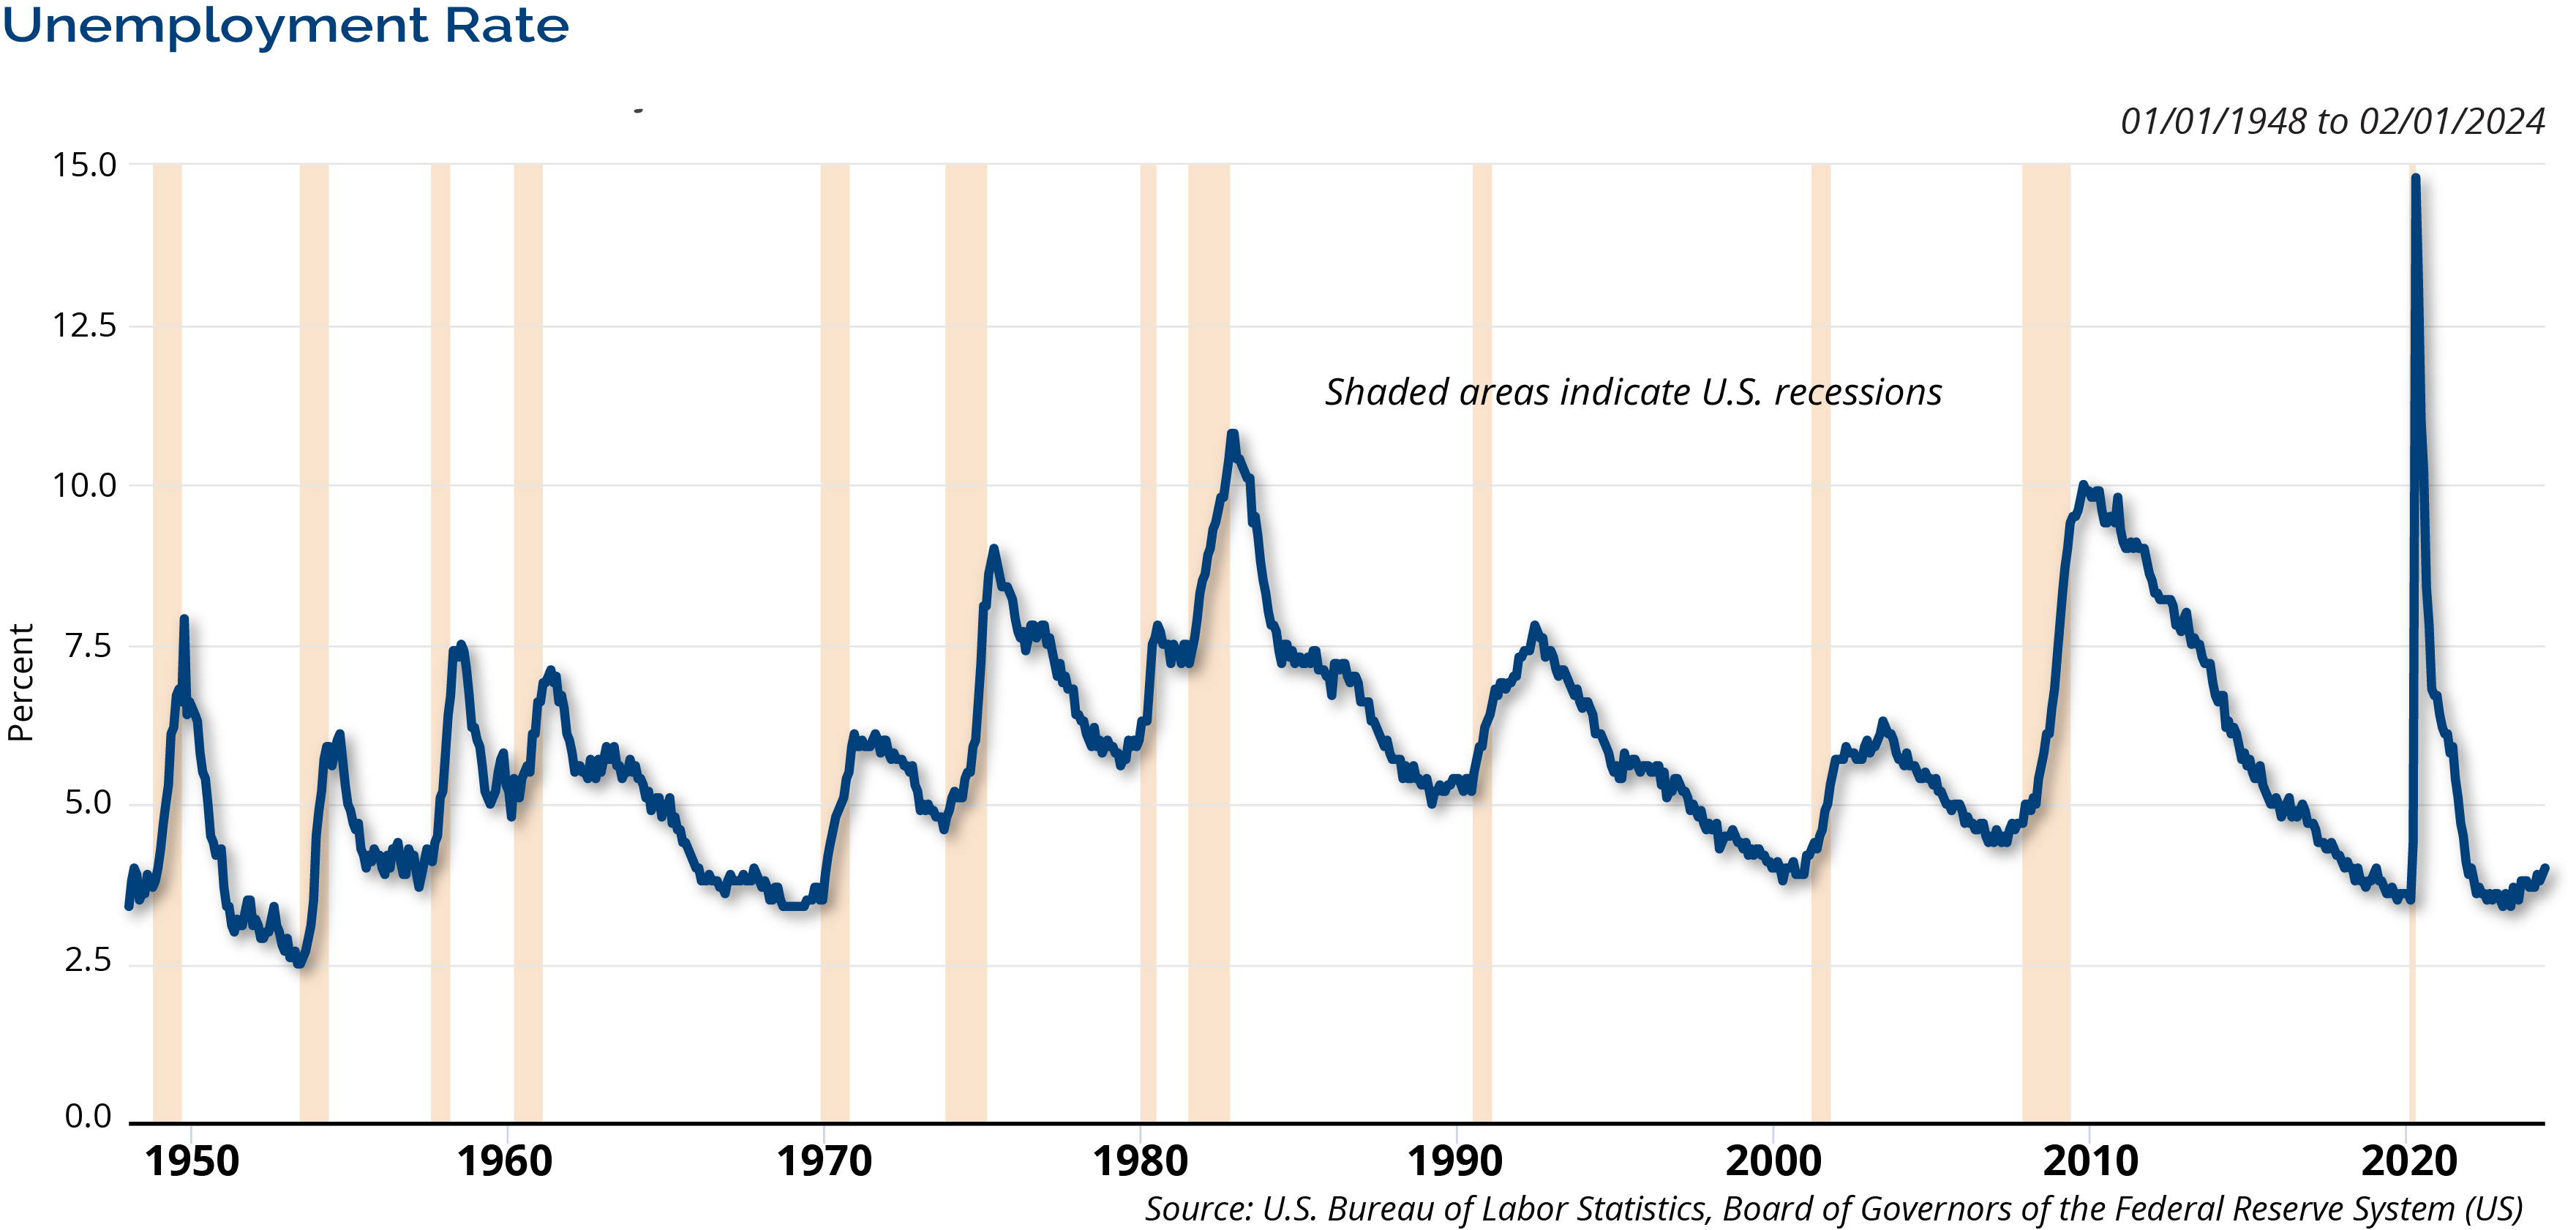
The Fed expects the unemployment rate to rise to 4.4% in 2023, up from the cycle low of 3.5% in July. Similar increases in the unemployment rate have a near-perfect record of leading to a recession.
We pose a question: is the Fed fighting yesterday’s inflation battle? Inflation has peaked and inflation expectations have remained well-anchored. The year-over-year Consumer Price Index (CPI) rate peaked in June at 9.1%. It has fallen to a year-over-year rate of 8.3% in August. While this is still too high, we believe it is likely to keep falling. Since that June inflation print, the last two month-over-month CPI numbers have been relatively unchanged, 0% and 0.1%. We feel inflation is coming off the boil, evidenced by the 26% decline in the Daily National Average Gasoline Price, the decline in the prices paid component of the ISM Manufacturing and Service Indices, and the drop off in used car prices and container freight costs. As the economy weakens and M2 money supply growth continues to slow, inflation is likely to continue to cool. The Fed was too optimistic regarding inflation last year, and now they may be too pessimistic.
In Fed Chairman Powell’s Jackson Hole speech, he said, “the public’s expectations about future inflation can play an important role in setting the path of inflation over time.” Inflation expectations remain well-anchored and they have fallen sharply from their peak levels across the curve. The 1, 3, 5, and 10-year inflation breakeven rates range between 2.25% – 2.56%.
Our main concern with the economy is that the Fed is hiking rates aggressively into falling inflation and a slowing economy. In our opinion, the window for the Fed to engineer a soft landing is closing rapidly. While Powell didn’t come out and say their base case is a recession, he can’t as the Fed Chairman, he clearly indicated that is becoming a higher probability event.
A couple of signposts that we have discussed in previous commentaries and Market Outlooks are leading indicators and the yield curve. The Conference Board’s Index of Leading Economic Indicators (LEI) peaked at an all-time high earlier this year and has now declined for 6 consecutive months. The recent high in leading indicators is important because over the past 60 years, early weakness in the LEI has preceded every recession in the US. Our preferred measure of the yield curve for forecasting the economy is the difference between the yield of the 10-year Treasury and 3-month T-bills. It has inverted before every recession over the past 60 years. So far this cycle the slope of the curve has remained positive, and as of this morning, it was positive by 37 bps. To be fair, other measures of the yield curve have already inverted. For example, the difference between the yield of the 10-year Treasury and 2-Year Treasury Notes has been inverted since early July, but those measures have historically given more false signals.
What does all of this mean for the markets? In our opinion, the spike in interest rates looks and feels like capitulation. The 2-Year Treasury Note is trading with a 4.12% yield. This is the first time since 2007 that 2-year notes have yielded more that 4%. The 10-year note is yielding 3.65%. If the economy is really slowing, then rates should peak out and fall. This would also be consistent with what intermediate and long-term rates have done in past Fed rate hike cycles.
The market is now in the retest phase of the mid-June lows. Investor sentiment is very pessimistic and according to the Bank of America Investment Manager survey, asset managers have one of their largest underweight equity positions ever. That represents a lot of potential buying pressure if we get the normal midterm election year rally into year-end. Turning to historical market behavior, stocks and bonds have historically started to move higher before the Fed is done raising rates. If the Fed’s own projections for future rate increases are accurate, we are now 2/3 of the way through this rate hike cycle – a point in time when the damage to stocks and bonds has been done and the recovery process has started. Remember the old adage, “the market climbs a wall of worry.” The wall is easy to see given the Fed’s hawkish tone and actions.
We know from history that the market bottoms before the Fed ends the rate hike cycle. Examining the past four rate hike cycles shows that the market bottomed an average of 67 calendar days after the first rate hike and 561 calendar days before the end of the rate hike cycle.
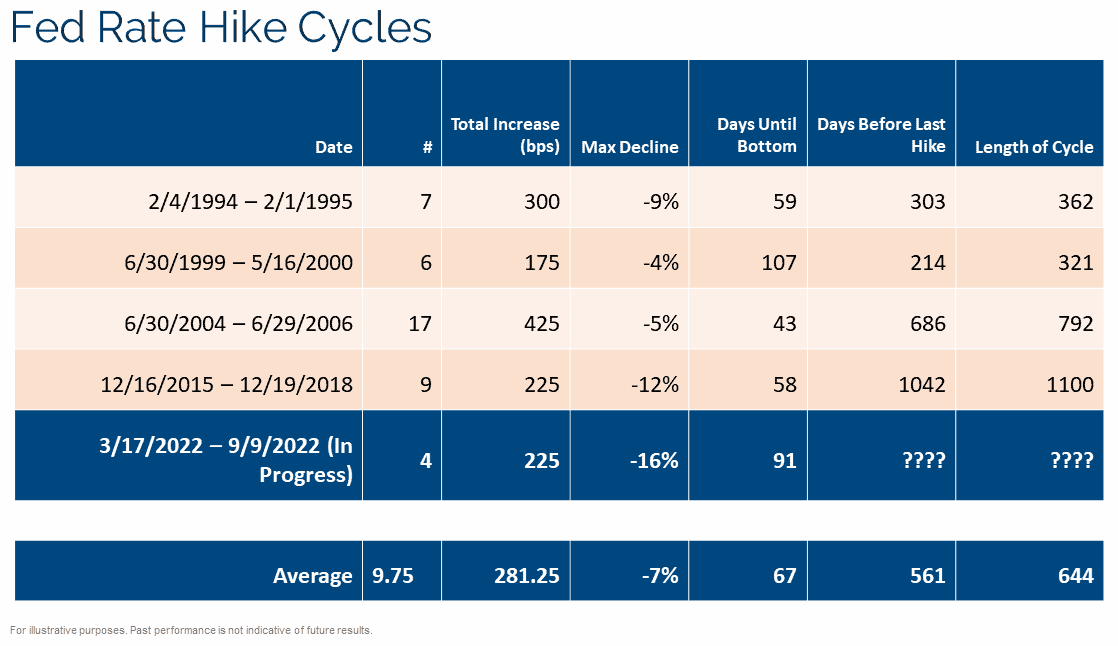
For illustrative purposes only. Past performance is not indicative of future results.
Disclosure
The opinions referenced are as of the date of publication and are subject to change due to changes in the market or economic conditions and may not necessarily come to pass. There is no guarantee of the future performance of any Clark Capital investment portfolio. Material presented has been derived from sources considered to be reliable, but the accuracy and completeness may not be guaranteed. Nothing herein should be construed as a solicitation, recommendation or an offer to buy, sell or hold any securities, other investments or to adopt any investment strategy or strategies. For educational purposes only. This material is not intended to be relied upon as a forecast or research. Investing involves risk, including the loss of principal. Past performance is not indicative of future results.
This document may contain certain information that constitutes forward-looking statements which can be identified by the use of forward-looking terminology such as “may,” “expect,” “will,” “hope,” “forecast,” “intended,” “target,” “believe,” and/or comparable terminology (or the negative thereof). Forward looking statements cannot be guaranteed. No assurance, representation, or warranty is made by any person that any of Clark Capital’s assumptions, expectations, objectives, and/or goals will be achieved.
Fixed income securities are subject to certain risks including, but not limited to: interest rate (changes in interest rates may cause a decline in market value or an investment), credit, prepayment, call (some bonds allow the issuer to call a bond for redemption before it matures), and extension (principal repayments may not occur as quickly as anticipated, causing the expected maturity of a security to increase). All investing involves risk, including loss of principal.
The Consumer Price Index (CPI) measures the change in prices paid by consumers for goods and services. The CPI reflects spending patterns for each of two population groups: all urban consumers and urban wage earners and clerical workers.
The 3 Month Treasury Bill Rate is the yield received for investing in a government issued treasury security that has a maturity of 3 months. The 3 month treasury yield is included on the shorter end of the yield curve and is important when looking at the overall US economy.
The 2 Year Treasury Rate is the yield received for investing in a US government issued treasury security that has a maturity of 2 years.
The 10 Year Treasury Rate is the yield received for investing in a US government issued treasury security that has a maturity of 10 year. The 10 year treasury yield is included on the longer end of the yield curve. Many analysts will use the 10 year yield as the “risk free” rate when valuing the markets or an individual security.
The Personal Consumption Expenditures Price Index (PCE) is a measure of the prices that people living in the United States, or those buying on their behalf, pay for goods and services. The PCE price index is known for capturing inflation (or deflation) across a wide range of consumer expenses and reflecting changes in consumer behavior.
The ISM manufacturing index, also known as the purchasing managers’ index (PMI), is a monthly indicator of U.S. economic activity based on a survey of purchasing managers at more than 300 manufacturing firms.
The Legal Entity Identifier (LEI) is designed to uniquely identify legal entities that are participants in financial transactions, thereby helping to create greater transparency in the marketplace.
Clark Capital Management Group, Inc. is an investment adviser registered with the U.S Securities and Exchange Commission. Registration does not imply a certain level of skill or training. More information about Clark Capital’s advisory services and fees can be found in its Form ADV which is available upon request.
CCM-500
![]()