
May 10, 2022 | In our 2022 Market Outlook, we highlighted that we thought the first half of the year was going to be challenging for the markets given the headwinds of inflation, rising interest rates, COVID, mid-term election year trends, and geopolitical concerns. We expected a 10-15% correction in the first half of the year. As of yesterday, the S&P 500 has declined 15.86% year to date.
The selling pressure has been extreme, but the major indices dont fully capture the extent of the weakness. For example, nearly 50% of the S&P 500 names are down more than 20% from their 52-week highs and over 80% of the Russell 2000 small-cap stocks are below their 200-day moving averages. As bad as it has been in the equity markets, bonds have also seen historic declines. The Bloomberg U.S. Aggregate Bond Market Total Return Index has lost 10.11% year to date and is trading further below its 200-day moving average than it has ever before. Momentum is clearly negative for the market as it reprices assets and adjusts to the new monetary regime of higher interest rates.
Last week, the Fed raised short-term interest rates by 50 basis points to a target range between 0.75% and 1%. That rise in rates follows a 25 basis point hike in March. The last time the Fed hiked rates by 50 basis points was in 2000. The Fed funds futures market is now pricing in at least two more 50 basis point rate hikes at each of the next two FOMC meetings. The Fed also announced its plan to begin shrinking its balance sheet by more than $1 trillion a year. These steps are all part of the Fed’s attempt to normalize monetary policy to combat inflation, which is currently running at four-decade highs.
Financial Conditions Tightening
Over the past week, post the Fed meeting, we have seen rates come in a bit. The 2-year Treasury yield, a good proxy for Fed policy looking out a year, has dropped about 20 basis points to 2.60%. The market may be beginning to price in less Fed rate hikes into the future. In addition, inflation breakeven rates have also come in off their recent highs.
Its possible that the bond market has already done a lot of the Fed’s work. Financial conditions have tightened significantly with higher market-based interest rates, a strong dollar, the national average of 30-year mortgage rates topping 5.5%, and the recent weakness in the stock market. Financial conditions can deteriorate more, but to the extent that inflation expectations might be peaking, we may have seen the bulk of the move.
Is Inflation Peaking?
We are on the lookout for signs that inflation may be peaking. There are signs in numerous 3-month percent changes in annual wage growth rates. On a year-over-year basis, the April employment report showed that average hourly earnings for all workers rose 5.5% year over year. However, the 3-month wage inflation rate has been falling below this rate for the past three months and was down to 3.7% during April. The same can be said for the 3-month wage inflation rate in goods-producing industries (4.1% vs. 5.2% year over year) and service-providing industries (3.6% vs. 5.6% year over year).
In our opinion, Wednesday’s release of the Consumer Price Index (CPI) will give further insight on the inflation story. If we haven’t hit peak inflation already, we think we are near. Besides the recent wage growth trends, auto inflation, which was almost half of the rise in inflation, has declined for the past four months. In addition, commodity prices have started to moderate. Copper and oil are down 13% and 20% from their recent highs.
Some measures of investor sentiment suggest a lot of bad news has been priced in. A recent survey from the American Association of Individual Investors (AAII) showed only 16% of investors were bullish. That is the lowest since September 1992. In prior times when AAII was this pessimistic, the market was higher 3, 6, and 12 months later.
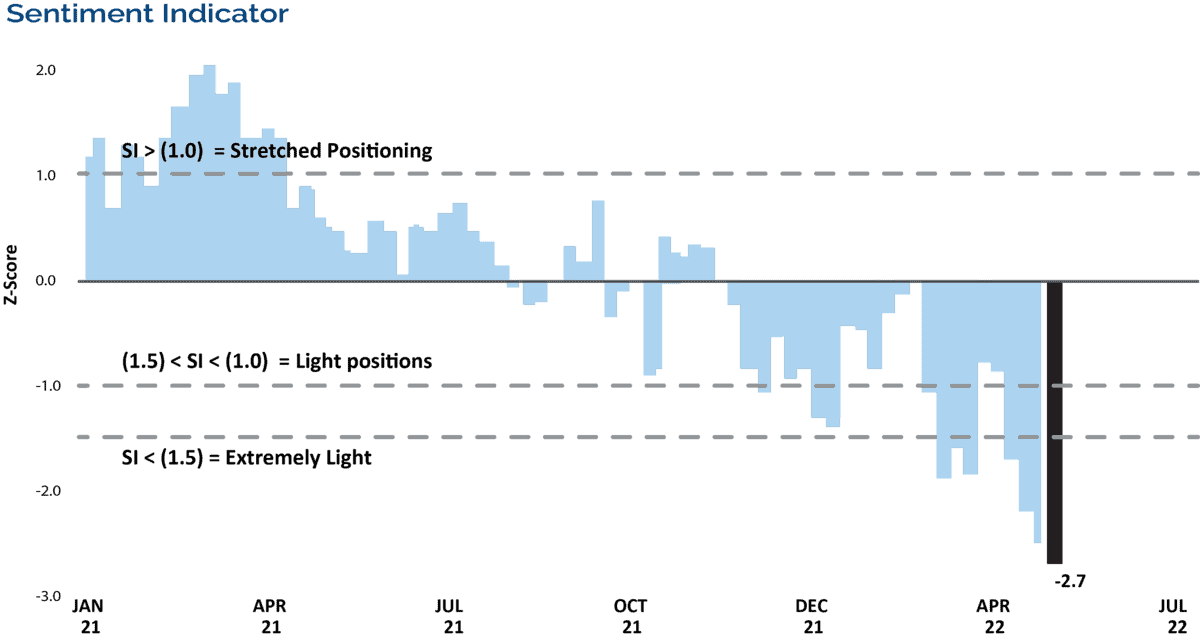
The below sentiment indicator from Goldman Sachs looks at the positioning of retail, institutional, and foreign investors, and confirms the message from the AAII survey. It currently shows that investor stock allocations are 2.7 standard deviations below average.
As we often say in our Market Updates, market volatility is normal and we believe that clients should remain focused on their long-term goals and objectives, and not be derailed by short-term swings in the markets.
Disclosure
The opinions referenced are as of the date of publication and are subject to change due to changes in the market or economic conditions and may not necessarily come to pass. There is no guarantee of the future performance of any Clark Capital investments portfolio. Material presented has been derived from sources considered to be reliable, but the accuracy and completeness cannot be guaranteed. Nothing herein should be construed as a solicitation, recommendation or an offer to buy, sell or hold any securities, other investments or to adopt any investment strategy or strategies. For educational use only. This information is not intended to serve as investment advice. This material is not intended to be relied upon as a forecast or research. Investing involves risk, including the loss of principal. The value of investments, and the income from them, can go down as well as up and you may get back less than the amount invested. Past performance is not indicative of future results.
The Standard and Poor’s 500, or simply the S&P 500, is a stock market index tracking the performance of 500 large companies listed on stock exchanges in the United States.
The Russell 2000 Index is a small-cap stock market index that makes up the smallest 2,000 stocks in the Russell 3000 Index.
The Bloomberg Aggregate Bond Index or “the Agg” is a broad-based fixed-income index used by bond traders and the managers of mutual funds and exchange-traded funds (ETFs) as a benchmark to measure their relative performance.
The 2 Year Treasury Rate is the yield received for investing in a US government issued treasury security that has a maturity of 2 years.
The Consumer Price Index (CPI) is a measure of the average change over time in the prices paid by urban consumers for a market basket of consumer goods and services. Indexes are available for the U.S. and various geographic areas.
This document may contain certain information that constitutes forward-looking statements which can be identified by the use of forward-looking terminology such as “may,” “expect,” “will,” “hope,” “forecast,” “intend,” “target,” “believe,” and/or comparable terminology (or the negative thereof). Forward looking statements cannot be guaranteed. No assurance, representation, or warranty is made by any person that any of Clark Capital’s assumptions, expectations, objectives, and/or goals will be achieved. Nothing contained in this document may be relied upon as a guarantee, promise, assurance, or representation as to the future.
Clark Capital Management Group, Inc. is an investment adviser registered with the U.S. Securities and Exchange Commission. Registration does not imply a certain level of skill or training. More information about Clark Capitals advisory services and fees can be found in its Form ADV which is available upon request.

