Strong Rebound in June Propels Gains for Q2 and Year to Date
HIGHLIGHTS:
- While large-cap growth companies still dominate results so far this year, equity progress broadened in June with widespread gains across stocks.
- The VIX Index, a measure of stock market volatility, dropped markedly in June. After closing May at 17.94, the VIX Index fell to a 52-week low in June, 12.73 (intraday), and ended the month at 13.59.
- Bonds faced a headwind in June as rates rose. The yield on the 10-year U.S. Treasury closed May at 3.64%, but it rose to 3.81% by the end of June.
- However, bond results were mixed with different pockets of fixed income behaving differently for the month. Most fixed income sectors remained positive year to date, but quarterly results were mixed.
- The job market continues to be the hero of the economy. Job additions in May (released in June) easily surpassed expectations and the “soft landing” narrative seems to be gaining some steam. However, there are still parts of the economy that are showing weakness despite the strong job market.
EQUITY MARKETS
Equities were the name of the game in June as stocks rallied across the board. Large-cap Technology companies still dominate the year-to-date results, but small-caps and mid-caps enjoyed better results for the month. Both value and growth rallied as style was of modest consequence. International stocks gained, but they could not keep pace with U.S. markets in June. See Table 1 for equity results for June, Q2, and year to date.
Table 1
| Index | June 2023 | Q2 2023 | YTD |
|---|---|---|---|
| S&P 500 | 6.61% | 8.74% | 16.89% |
| S&P 500 Equal Weight | 7.72% | 3.99% | 7.03% |
| DJIA | 4.68% | 3.97% | 4.94% |
| Russell 3000 | 6.83% | 8.39% | 16.17% |
| NASDAQ Comp. | 6.65% | 13.05% | 32.32% |
| Russell 2000 | 8.13% | 5.21% | 8.09% |
| MSCI ACWI ex U.S. | 4.49% | 2.44% | 9.47% |
| MSCI Emerging Mkts Net | 3.80% | 0.90% | 4.89% |
The rally in stocks in June righted much of the broader weakness seen in stocks so far this year. For example, as discussed last month, the equal-weighted S&P 500 Index (which can be thought of as representing what the average stock is doing) was negative through the first five months of the year. That reversed in June as those monthly gains (7.72%) propelled this index higher for the quarter (3.99%) and year to date (7.03%). The same holds true for small-caps, which now show a solid first half of the year at 8.09%, but that was all due to gains in June, which were 8.13%.
The mega-cap Technology companies continued to enjoy a strong recovery from their 2022 declines and that can clearly be seen in the results of the NASDAQ. The tech-heavy NASDAQ Composite added to already solid gains with more progress in June, which pushed this index to a better than 13% quarterly gain and a first half which topped a 32% advance. Broad international equities had a solid month, but those gains of 4.49% lagged U.S. markets in June. Year-to-date gains for the Dow and MSCI Emerging Markets lag the other major indices as both were shy of a 5% advance.
Style did not matter much in June, but it still played a major role halfway through 2023. Large-cap growth stocks, as measured by the Russell 1000 Growth Index, dominated with a year-to-date gain of 29.02%. Its value counterpart, the Russell 1000 Value Index, gained only 5.12% through the first six months of 2023. Gains in June for these two indices were both strong at 6.84% and 6.64%, respectively.
Fixed Income
Yields have been on a roller coaster ride so far in 2023. After breaking above the 4% mark for the first time in years in early March, the 10-year U.S. Treasury yield slumped to 3.3% in early April. While volatile, rates generally trended higher from that low point and they continued to rise further in June closing the month at 3.81%, which was an increase from the ending Q1 mark of 3.48%. Bond results were mixed during the month as interest rate sensitive pockets struggled. Corporate bonds made some progress as stocks rallied and municipal bonds made gains after a rather lackluster performance earlier in the year. See Table 2 for fixed income index returns for June, Q2, and year to date.
Table 2
| Index | June 2023 | Q2 2023 | YTD |
|---|---|---|---|
| Bloomberg U.S. Agg | -0.36% | -0.84% | 2.09% |
| Bloomberg U.S. Credit | 0.31% | -0.31% | 3.13% |
| Bloomberg U.S. High Yld | 1.67% | 1.75% | 5.38% |
| Bloomberg Muni | 1.00% | -0.10% | 2.67% |
| Bloomberg 30-year U.S. TSY | 0.21% | -2.36% | 3.49% |
| Bloomberg U.S. TSY | -0.75% | -1.38% | 1.59% |
We expect the 10-year U.S. Treasury yield to move lower as we go through the rest of 2023, but we also anticipate volatility along the way. Enjoying solid gains for the month and the quarter, high yield bonds have been the clear winner so far in 2023, not that surprising on the heels of such solid stock market gains. Municipal bonds had a strong month, which negated much of the weakness from the first part of the second quarter. While U.S. Treasuries struggled in general in June, ironically the yield on the 30-year U.S. Treasury closed May and June flat at 3.85%. Treasuries show gains so far this year, but the upswing in yields in Q2 took back some of the progress from the first quarter. Bonds have enjoyed a better environment in 2023 compared to a historically challenging period for fixed income in 2022.
After a “skip” in June, the market is anticipating the Fed will resume rate hikes at the July FOMC meeting. The June 2023 meeting was the first FOMC meeting since this rate-hike cycle began in March 2022 without an increase in policy rates. We maintain our opinion that we are in the late innings of this rate hike cycle, but it looks like we might have at least one more rate hike in the second half of 2023. We also maintain our long-standing position favoring credit versus pure rate exposure in this interest rate environment. Finally, we believe the role bonds play in a portfolio, to provide stable cash flows and to help offset the volatility of stocks in the long run, has not changed.
Economic Data and Outlook
The third GDP report for the first quarter of 2023 provided a nice surprise when the final revision showed annualized growth at 2.0%, easily exceeding expectations of 1.4% and the prior estimate of 1.3%. An increase in personal consumption (meaning consumer spending) helped push that number higher. We still expect economic growth to slow down later in the year and we acknowledge the risk of a mild recession still exists and is about as likely as a soft landing in our opinion.
However, the soft-landing narrative seems to be picking up some steam with the ongoing strength exhibited in the job market. Coming off a reading of 3.4% in April, which matched the lowest unemployment level since 1969, the unemployment rate increased to 3.7% in May as the labor force participation rate remained steady at 62.6%. However, non-farm payrolls increased by 339,000 in May compared to estimates of 195,000 and the prior month’s reading of 294,000. Chart 1 shows job openings, while high, peaked over a year ago and have been moving lower as employment has continued to climb higher.
Chart 1
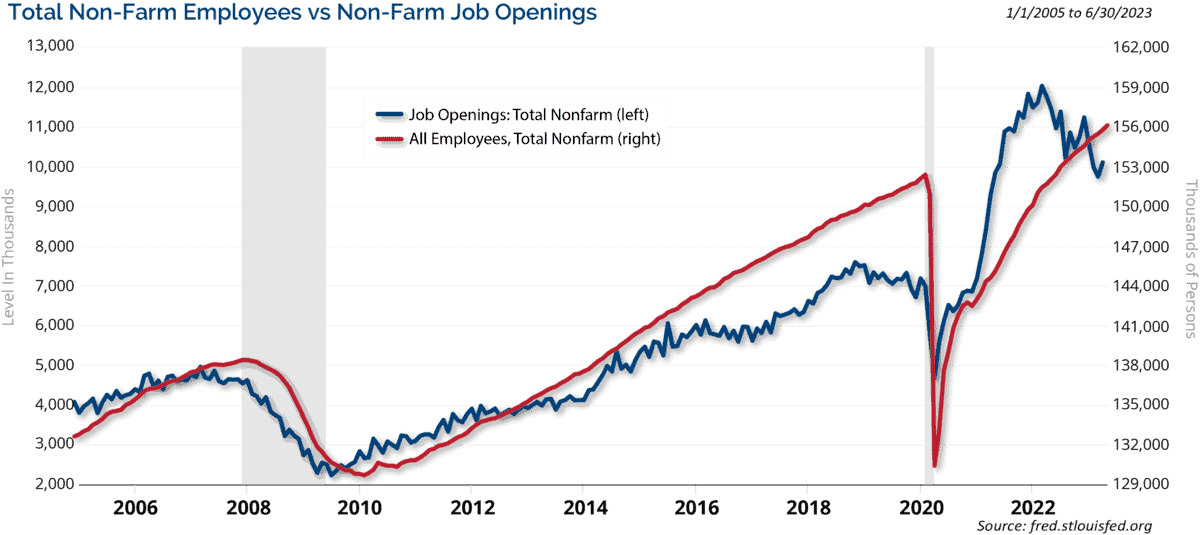
For illustrative purposes only. For illustrative purposes only. Past performance is not indicative of future results. Projections or other forward looking statements regarding future financial performance of markets are only predictions and actual events or results may differ materially.
The mismatch between job seekers and job openings still shows millions more open jobs available than people looking for work. Businesses might be slowing their hiring activity with concerns about potential weaker economic conditions as job openings have come down. However, the job market remains strong, and it seems unlikely that the economy will slow too much with this core part of our economic system remaining healthy.
Wages climbed by 4.3% on an annual basis in May, which was below expectations and April’s mark of 4.4%. The Fed aggressively raising rates over the last year is expected to increase unemployment, but Fed rate hikes so far have not resulted in significant weakness in the job market outside of the Technology sector. Too much strength in job market data could be viewed as inflationary by Fed officials and extend this period of restrictive monetary policy. We will watch for developments in the job market closely with consumer spending accounting for about 70% of U.S. economic activity.
Housing data was largely better than expected in May. Building permits, considered a leading indicator for housing, were at an annualized pace of 1.491 million, which was better than expectations of 1.425 million and an improvement from April. Housing starts surged higher at a 1.631 million annual pace – easily surpassing the 1.400 million estimate and the prior month’s level of 1.340 million. Existing home sales and new home sales also both improved from April and exceeded expectations.
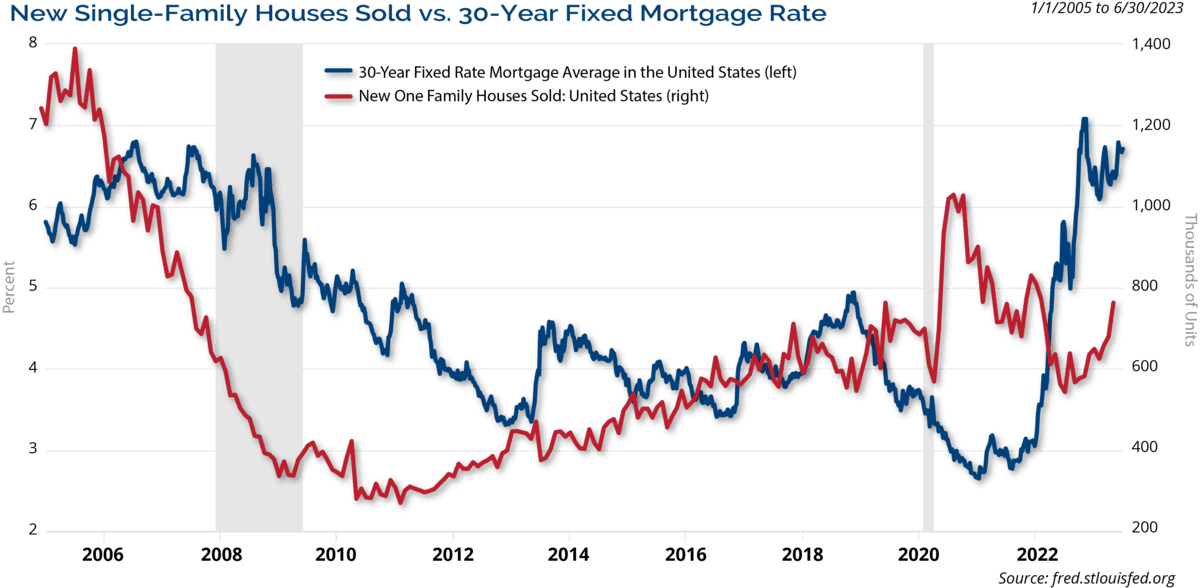
Home prices fell in April based on the S&P CoreLogic 20-City Index, but the decline was more modest than expected. Mortgage rates, which have climbed significantly over the last year or so, seem to be flattening out, albeit at an elevated level. Chart 2 shows the impact that higher mortgages have had on new home sales. New home sales surged in the latter part of 2020 around the same time that mortgage rates hit their low, but higher rates have slowed activity recently. The recent pick up in new home sales might be reflecting the market adjusting for higher mortgage rates, which seem to have plateaued in recent months.
Chart 2
 For illustrative purposes only. Past performance is not indicative of future results.
The ISM Manufacturing Index showed contraction for the 7th consecutive month in May with a reading of 46.9. (A contraction in June was reported in July to make it the 8th straight month.) The May mark was modestly below expectations of 47.0 and the prior month mark of 47.1. The ISM Non-Manufacturing Index, which covers the much larger service industries in the U.S. economy, fell unexpectedly to 50.3, which was the lowest level of 2023.
Expectations were calling for an improvement to 52.4 from the April level of 51.9. The service index has slowed in recent months, but it continues to be above 50, the dividing line between expansion and contraction for the ISM readings.
Retail sales (ex. auto and gas) rose by 0.4% in May, which was twice the expected increase of 0.2%. The preliminary University of Michigan Sentiment reading for June rose to 63.9 compared to expectations of 60.0 and the prior reading of 59.2. The resolution of the debt-ceiling debate likely contributed to a better mood by consumers after it had been a negative news item for weeks leading up to an agreement. The Conference Board’s Leading Index continued to decline and fell by -0.7% in May, which was modestly better than the expected -0.8% decline.
Inflation readings continued to improve in May, but core readings remain higher than headline readings driven in part by lower energy prices impacting the headline number, but not the core. The headline Consumer Price Index (CPI) for May dropped to a 4.0% annual increase, better than expectations of 4.1% and a clear improvement from the prior month’s level of 4.9%. The core CPI was 5.3%, improved from the prior month but slightly higher than expectations.
The headline Producer Price Index (PPI) fell to a 1.1% annual increase, better than expectations of 1.5% and the prior month’s mark of 2.3%. The core PPI was 2.8%, modestly better than expectations of 2.9% and better than the 3.1% increase from April. The Producer Price Index is generally seen as a leading indicator for inflation since these costs occur during the production part of the cycle before products are sold to consumers. Ongoing declines in this index bode well for continued improvements on the inflation front.
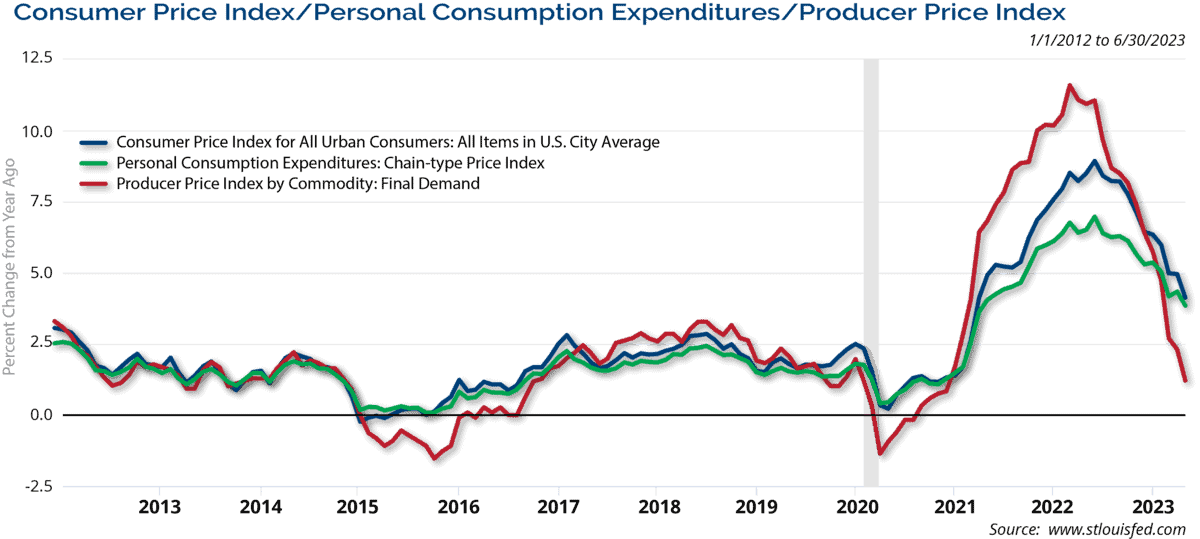
The Personal Consumption Expenditures (PCE) Index showed a 3.8% annual gain in May from the 4.3% level in April, and this was in-line with expectations. The Fed’s preferred measure of inflation, the core PCE reading, showed a 4.6% annual rise, modestly better than expectations and the prior month of 4.7%. Overall, it seems clear that the trajectory for inflation is lower and we expect inflation to continue this trend through 2023. Chart 3 shows the percent change from a year ago for these headline inflation readings and the clear trend lower.
Chart 3
For illustrative purposes only. Past performance is not indicative of future results.
The market is still adjusting to the impact of the rate increases that began in March 2022. We have now had the first pause or “skip” in this Fed rate-hike cycle as the Fed made no change to policy rates in June, but at least one more rate hike is expected in the second half of 2023. As the economy remains resilient, the Fed rate hike cycle might last longer than many had expected.
Although economic growth picked up in the second half of 2022, we believed that momentum would continue early in 2023. We also expected growth to slow later in 2023 and believed the odds of a mild recession were about 50/50. The job market has remained resilient, which leads us to the conclusion that any economic slowdown would be modest.
However, the recent decline in job openings might be an initial sign of more caution by employers in hiring with an expected weaker economic backdrop later in 2023. As always, we believe it is imperative for investors to stay focused on their long-term goals and not let short-term swings in the market derail them from their longer-term objectives.
Investment Implications
Clark Capital’s Top-Down, Quantitative Strategies
Technology and Communications sectors led gains while defensive sectors such as Utilities, Staples, and Real Estate lagged. Historically, momentum begets more momentum. When the S&P 500 rose at least 10% over the first six months, the index rose in the following six months 75% of the time by a median 9.7%.
Strong credit conditions, record amounts of cash sitting in money market funds, and declining inflation remain some of the underpinnings of this market. Our tactical portfolios remain fully invested in risk-on vehicles with allocations to high yield and global equity. The portfolios are overweight growth versus value.
Clark Capital’s Bottom-Up, Fundamental Strategies
Across the bottom-up equity strategies, we continue to balance portfolio holdings between dominant large-cap growth companies and those anti-fragile large, small, and mid-cap companies that we believe continue to see strong business momentum.
After a strong performance in 2022, low beta dividend stocks underperformed in the first half, posting their worst performance versus non-dividend paying companies since 2009, according to Ned Davis Research.
Within the bottom-up fixed income portfolios, the focus continued to be on improving liquidity and credit quality while also increasing the yield on the portfolio. Dislocations in the market have continued, especially with the move in interest rates and the further inversion of the Treasury yield curve.
ECONOMIC DATA
| Event | Period | Estimate | Actual | Prior | Revised |
|---|---|---|---|---|---|
| ISM Manufacturing | May | 47 | 46.9 | 47.1 | — |
| ISM Services Index | May | 52.4 | 50.3 | 51.9 | — |
| Change in Nonfarm Payrolls | May | 195k | 339k | 253k | 294k |
| Unemployment Rate | May | 3.5% | 3.7% | 3.4% | — |
| Average Hourly Earnings YoY | May | 4.4% | 4.3% | 4.4% | — |
| JOLTS Job Openings | Mar | 9736k | 9590k | 9931k | 9974k |
| PPI Final Demand MoM | May | -0.1% | -0.3% | 0.2% | — |
| PPI Final Demand YoY | May | 1.5% | 1.1% | 2.3% | — |
| PPI Ex Food and Energy MoM | May | 0.2% | 0.2% | 0.2% | — |
| PPI Ex Food and Energy YoY | May | 2.9% | 2.8% | 3.2% | 3.1% |
| CPI MoM | May | 0.1% | 0.1% | 0.4% | — |
| CPI YoY | May | 4.1% | 4.0% | 4.9% | — |
| CPI Ex Food and Energy MoM | May | 0.4% | 0.4% | 0.4% | — |
| CPI Ex Food and Energy YoY | May | 5.2% | 5.3% | 5.5% | — |
| Retail Sales Ex Auto and Gas | May | 0.2% | 0.4% | 0.6% | 0.5% |
| Industrial Production MoM | May | 0.1% | -0.2% | 0.5% | — |
| Building Permits | May | 1425k | 1491k | 1416k | 1417k |
| Housing Starts | May | 1400k | 1631k | 1401k | 1340k |
| New Home Sales | May | 676k | 763k | 683k | 680k |
| Existing Home Sales | May | 4.25m | 4.30m | 4.28m | 4.29m |
| Leading Index | May | -0.8% | -0.7% | -0.6% | — |
| Durable Goods Orders | May P | -0.9% | 1.7% | 1.1% | 1.2% |
| GDP Annualized QoQ | 1Q T | 0.014 | 2.0% | 1.3% | — |
| U. of Mich. Sentiment | June P | 6000.0% | 6390.0% | 5920.0% | — |
| Personal Income | May | 0.3% | 0.4% | 0.4% | 0.3% |
| Personal Spending | May | 0.2% | 0.1% | 0.8% | 0.6% |
| S&P CoreLogic CS 20-City YoY NSA | Apr | -2.4% | -1.7% | -1.2% | -1.1% |
Source: Bloomberg
Past performance is not indicative of future results. The opinions referenced are as of the date of publication and are subject to change due to changes in the market or economic conditions and may not necessarily come to pass. Material presented has been derived from sources considered to be reliable and has not been independently verified by us or our personnel. Nothing herein should be construed as a solicitation, recommendation or an offer to buy, sell or hold any securities, other investments or to adopt any investment strategy or strategies. Investors must make their own decisions based on their specific investment objectives and financial circumstances. Investing involves risk, including loss of principal.
Clark Capital Management Group is an investment adviser registered with the U.S. Securities and Exchange Commission. Registration does not imply a certain level of skill or training. More information about Clark Capital Management Group’s advisory services can be found in its Form ADV which is available upon request.
Fixed income securities are subject to certain risks including, but not limited to: interest rate (changes in interest rates may cause a decline in market value or an investment), credit, prepayment, call (some bonds allow the issuer to call a bond for redemption before it matures), and extension (principal repayments may not occur as quickly as anticipated, causing the expected maturity of a security to increase).
Clark Capital utilizes a proprietary investment model to assist with the construction of the strategy and to assist with making investment decisions. Investments selected using this process may perform differently than expected as a result of the factors used in the model, the weight placed on each factor, and changes from the factors’ historical trends. There is no guarantee that Clark Capital’s use of a model will result in effective investment decisions.
Non-investment-grade debt securities (high-yield/junk bonds) may be subject to greater market fluctuations, risk of default or loss of income and principal than higher-rated securities.
Foreign securities are more volatile, harder to price and less liquid than U.S. securities. They are subject to different accounting and regulatory standards and political and economic risks. These risks are enhanced in emerging market countries.
The value of investments, and the income from them, can go down as well as up and you may get back less than the amount invested.
Equity securities are subject to price fluctuation and possible loss of principal. Stock markets tend to move in cycles, with periods of rising prices and periods of falling prices. Certain investment strategies tend to increase the total risk of an investment (relative to the broader market). Strategies that concentrate their investments in limited sectors are more vulnerable to adverse market, economic, regulatory, political, or other developments affecting those sectors.
JOLTS is a monthly report by the Bureau of Labor Statistics (BLS) of the U.S. Department of Labor counting job vacancies and separations, including the number of workers voluntarily quitting employment.
The Producer Price Index (PPI) program measures the average change over time in the selling prices received by domestic producers for their output. The prices included in the PPI are from the first commercial transaction for many products and some services.
References to market or composite indices, benchmarks or other measures of relative market performance over a specified period of time (each, an “index”) are provided for your information only. Reference to an index does not imply that the portfolio will achieve returns, volatility or other results similar to that index. The composition of the index may not reflect the manner in which a portfolio is constructed in relation to expected or achieved returns, portfolio guidelines, restrictions, sectors, correlations, concentrations, volatility or tracking error targets, all of which are subject to change. Investors cannot invest directly in an index.
The Bloomberg Barclays U.S. Municipal Index covers the USD-denominated long-term tax exempt bond market. The index has four main sectors: state and local general obligation bonds, revenue bonds, insured bonds and prerefunded bonds.
The Bloomberg US Treasury Index measures US dollar-denominated, fixed-rate, nominal debt issued by the US Treasury. Treasury bills are excluded by the maturity constraint, but are part of a separate Short Treasury Index.
The Dow Jones Industrial Average indicates the value of 30 large, publicly owned companies based in the United States.
The NASDAQ Composite is a stock market index of the common stocks and similar securities listed on the NASDAQ stock market.
The S&P 500 measures the performance of the 500 leading companies in leading industries of the U.S. economy, capturing 80% of U.S. equities.
The S&P 500® Equal Weight Index (EWI) is the equal-weight version of the widely-used S&P 500. The index includes the same constituents as the capitalization weighted S&P 500, but each company in the S&P 500 EWI is allocated a fixed weight – or 0.2% of the index total at each quarterly rebalance.
The University of Michigan Consumer Sentiment Index rates the relative level of current and future economic conditions. There are two versions of this data released two weeks apart, preliminary and revised. The preliminary data tends to have a greater impact. The reading is compiled from a survey of around 500 consumers.
The Russell 1000 Growth Index measures the performance of the large-cap growth segment of the U.S. equity universe. It includes those Russell 1000 Index companies with higher price-to-book ratios and higher forecasted growth values.
The Russell 1000 Value Index measures the performance of the large-cap value segment of the U.S. equity universe. It includes those Russell 1000 Index companies with lower price-to-book ratios and lower forecasted growth values.
The Russell 2000 Index is a small-cap stock market index that represents the bottom 2,000 stocks in the Russell 3000.
The Russell 3000 Index measures the performance of the 3,000 largest U.S. companies based on total market capitalization, which represents approximately 98% of the investable U.S. equity market.
The 10 Year Treasury Rate is the yield received for investing in a US government issued treasury security that has a maturity of 10 year. The 10 year treasury yield is included on the longer end of the yield curve. Many analysts will use the 10 year yield as the “risk free” rate when valuing the markets or an individual security.
The Bloomberg Barclays U.S. Corporate High-Yield Index covers the U.S. dollar-denominated, non-investment grade, fixed-rate, taxable corporate bond market. Securities are classified as high-yield if the middle rating of Moody’s, Fitch, and S&P is Ba1/BB+/BB+ or below.
The Bloomberg Barclays U.S. Credit Index measures the investment grade, U.S. dollar denominated, fixed-rate taxable corporate and government related bond markets.
The Bloomberg Aggregate Bond Index or “the Agg” is a broad-based fixed-income index used by bond traders and the managers of mutual funds and exchange-traded funds (ETFs) as a benchmark to measure their relative performance.
The 30-Year Treasury is a U.S. Treasury debt obligation that has a maturity of 30 years. The 30-year Treasury used to be the bellwether U.S. bond but now most consider the 10-year Treasury to be the benchmark.
The ISM Non-Manufacturing Index is an index based on surveys of more than 400 non-manufacturing firms’ purchasing and supply executives, within 60 sectors across the nation, by the Institute of Supply Management (ISM). The ISM Non-Manufacturing Index tracks economic data, like the ISM Non-Manufacturing Business Activity Index. A composite diffusion index is created based on the data from these surveys, that monitors economic conditions of the nation.
ISM Manufacturing Index measures manufacturing activity based on a monthly survey, conducted by Institute for Supply Management (ISM), of purchasing managers at more than 300 manufacturing firms.
The MSCI Emerging Markets Index captures large and mid cap representation across 27 Emerging Markets (EM) countries.
The MSCI ACWI ex USA Index captures large and mid cap representation across 22 of 23 Developed Markets (DM) countries (excluding the US) and 27 Emerging Markets (EM) countries*. With 2,359 constituents, the index covers approximately 85% of the global equity opportunity set outside the US
The S&P CoreLogic Case-Shiller 20-City Composite Home Price NSA Index seeks to measures the value of residential real estate in 20 major U.S. metropolitan areas. The U.S. Treasury index is based on the recent auctions of U.S. Treasury bills. Occasionally it is based on the U.S. Treasury’s daily yield curve.
The Consumer Price Index (CPI) measures the change in prices paid by consumers for goods and services. The CPI reflects spending patterns for each of two population groups: all urban consumers and urban wage earners and clerical workers.
In the United States, the Core Personal Consumption Expenditure Price (CPE) Index provides a measure of the prices paid by people for domestic purchases of goods and services, excluding the prices of food and energy.
The VIX Index is a calculation designed to produce a measure of constant, 30-day expected volatility of the U.S. stock market, derived from real-time, mid-quote prices of S&P 500® Index (SPX℠) call and put options. On a global basis, it is one of the most recognized measures of volatility — widely reported by financial media and closely followed by a variety of market participants as a daily market indicator.
The Conference Board’s Leading Indexes are the key elements in an analytic system designed to signal peaks and troughs in the business cycle. The leading, coincident, and lagging economic indexes are essentially composite averages of several individual leading, coincident, or lagging indicators. They are constructed to summarize and reveal common turning point patterns in economic data in a clearer and more convincing manner than any individual component – primarily because they smooth out some of the volatility of individual components.
Gross domestic product (GDP) is the standard measure of the value added created through the production of goods and services in a country during a certain period.
Index returns include the reinvestment of income and dividends. The returns for these unmanaged indexes do not include any transaction costs, management fees or other costs. It is not possible to make an investment directly in any index.
CCM-993
![]()

